Inside the Sales Appointments of the Top 10% of Reps


For years, sales leaders made coaching decisions without full visibility into real sales appointments. Not because they lacked rigor—but because observing every conversation at scale wasn’t possible. Ride-alongs showed a handful of moments. The rest had to be inferred.
With Rilla Intelligence, that constraint disappears. We can now observe sales behavior across thousands of real appointments and answer a long-standing question:
What behaviors consistently separate the top 10% of sales reps from everyone else?
Our Methodology
We analyzed thousands of in-person sales appointments using Rilla Intelligence. For each appointment, we measured observable rep behaviors—including appointment duration, script compliance, patience, and conversational interactivity—and modeled how each relates to close probability.
We then compared behavior distributions between top-performing reps (top 10% by revenue) and the average rep to identify which behaviors top performers consistently exhibit.
Appointment Duration and Close Probability
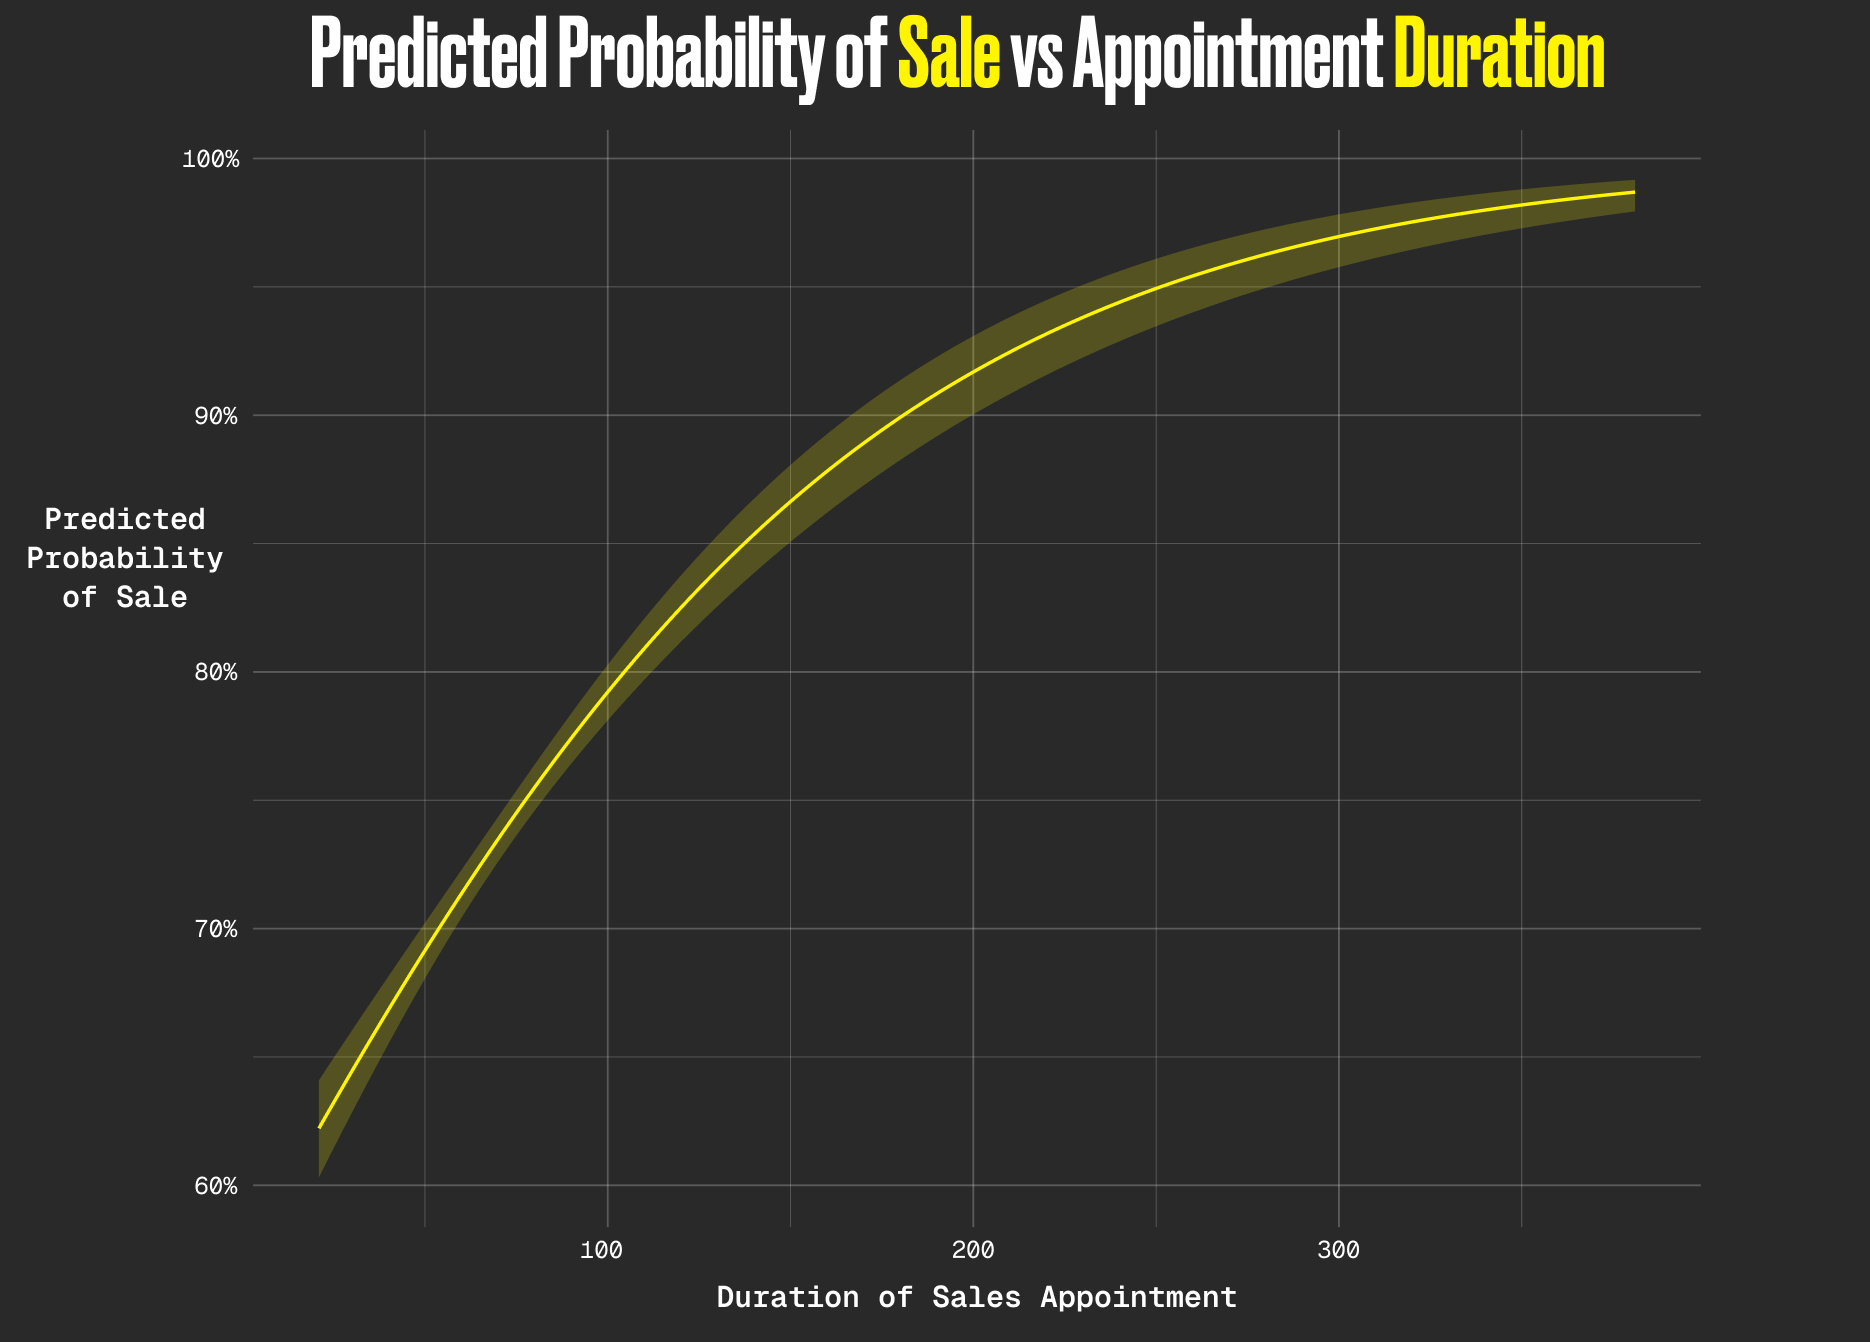
This visualization shows a strong positive relationship between appointment duration and the probability of closing a sale. Predicted close rates increase from approximately 70% for appointments under 60 minutes to over 90% for conversations lasting more than 200 minutes. The shaded bands represent 95% confidence intervals around the model’s predictions.
While successful appointments often run longer due to financing or logistics, the strength of this relationship suggests something more fundamental. Longer appointments allow for deeper discovery, more thorough objection handling, and greater patience throughout the customer’s decision-making process. Top performers are not staying longer because a deal is already won—they are staying longer to create the conditions that make a deal more likely.
Script Compliance and Close Probability
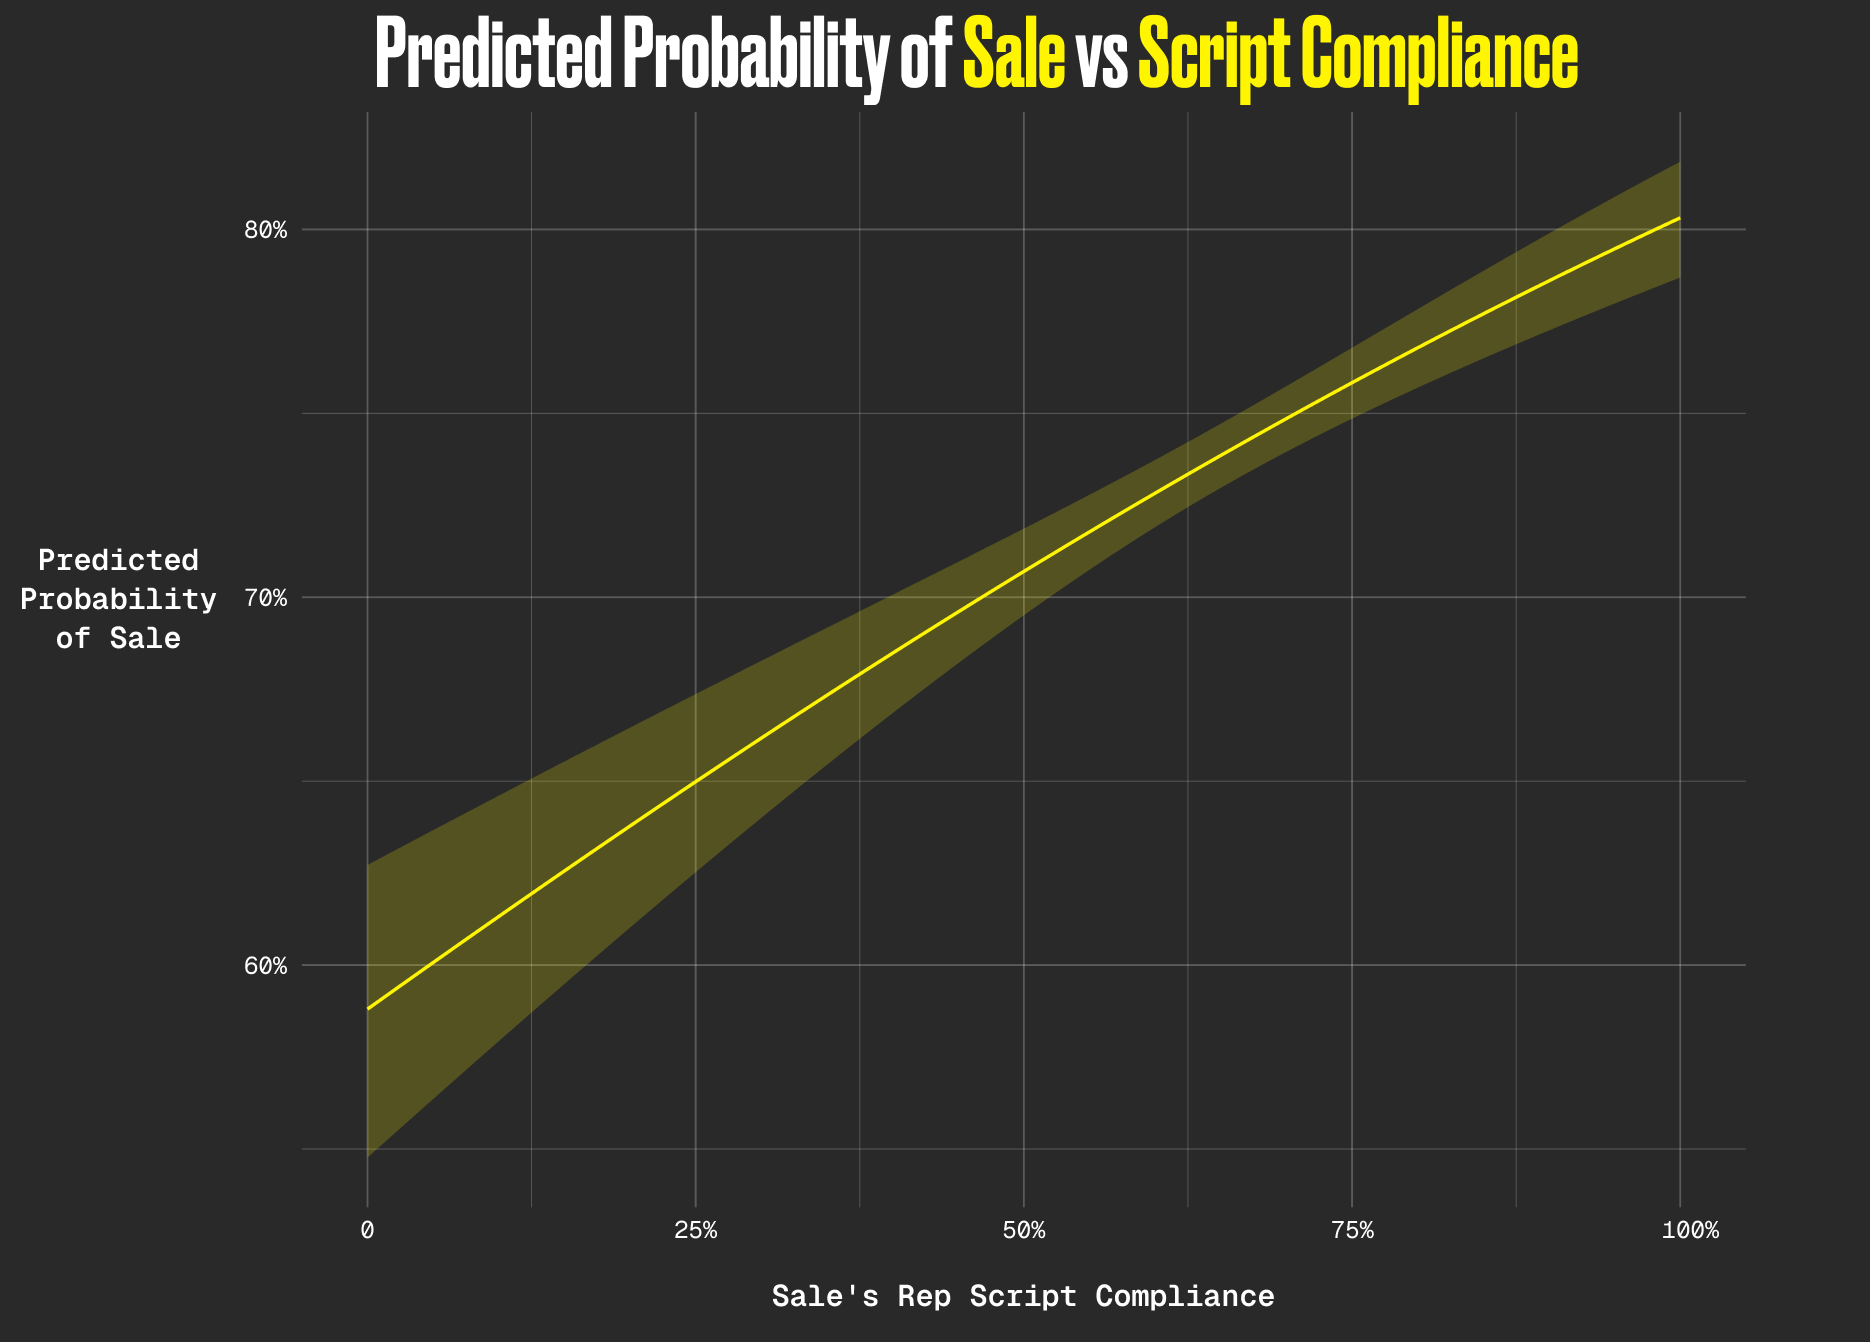
This visualization shows that higher script compliance is associated with meaningfully improved close rates. Reps following the script roughly 75% of the time achieve predicted success rates above 75%, compared to approximately 65% for reps following the script only 25% of the time.
Rather than limiting performance, the script appears to function as a stabilizing framework. Higher compliance ensures critical steps—such as discovery, value framing, and objection handling—are consistently covered, reducing variability in execution.
Script Compliance Among Top Performers
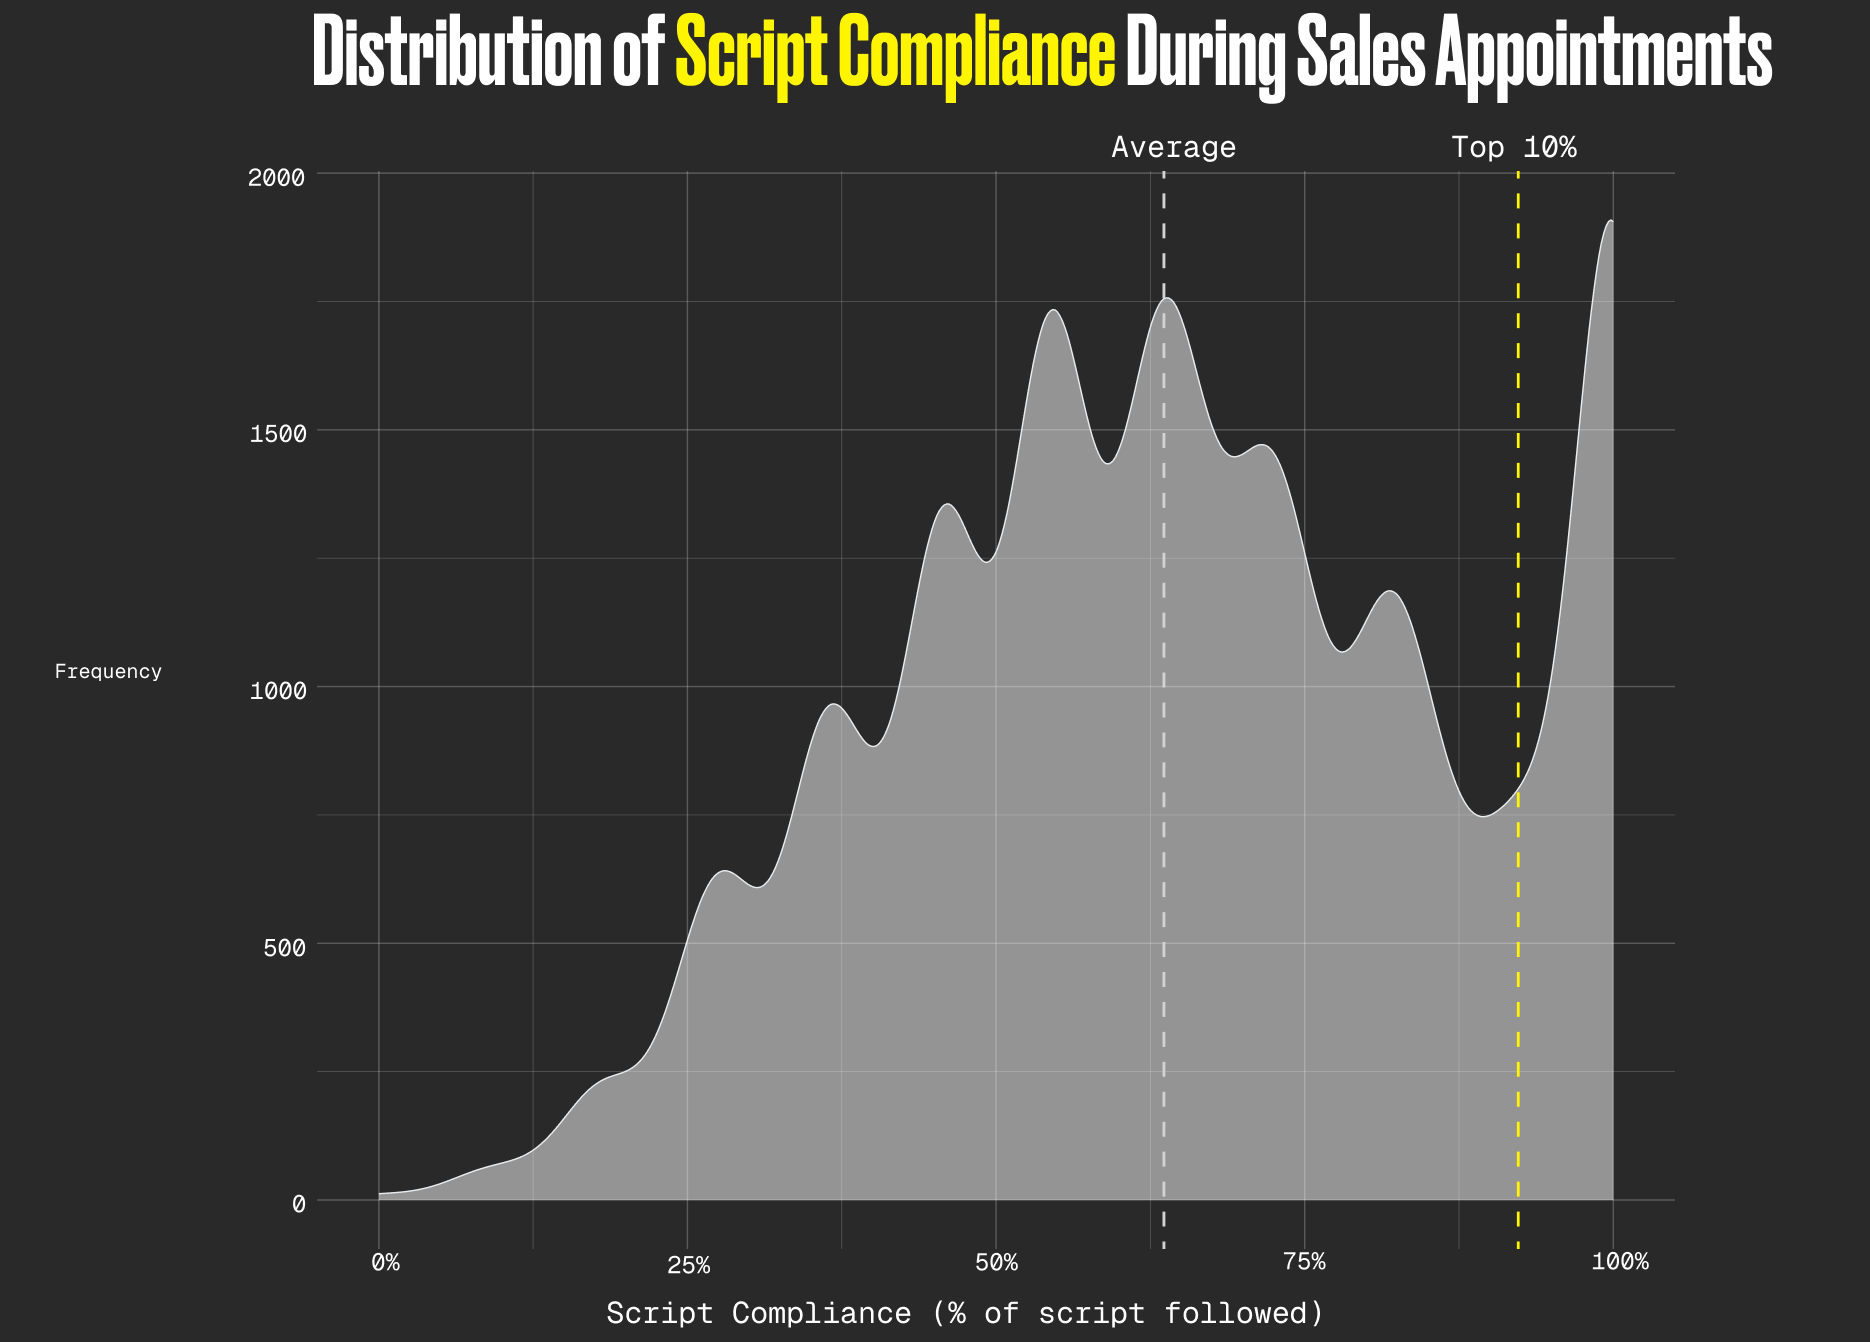
This density plot shows a clear shift in script compliance between the two groups. Top-performing reps demonstrate substantially higher adherence, with a median above 92%, compared to approximately 64% for the average rep.
The shape of the distribution indicates this is not driven by a small group of outliers. High script compliance is a consistent, defining behavior of top performers.
Interactivity Among Top Performers
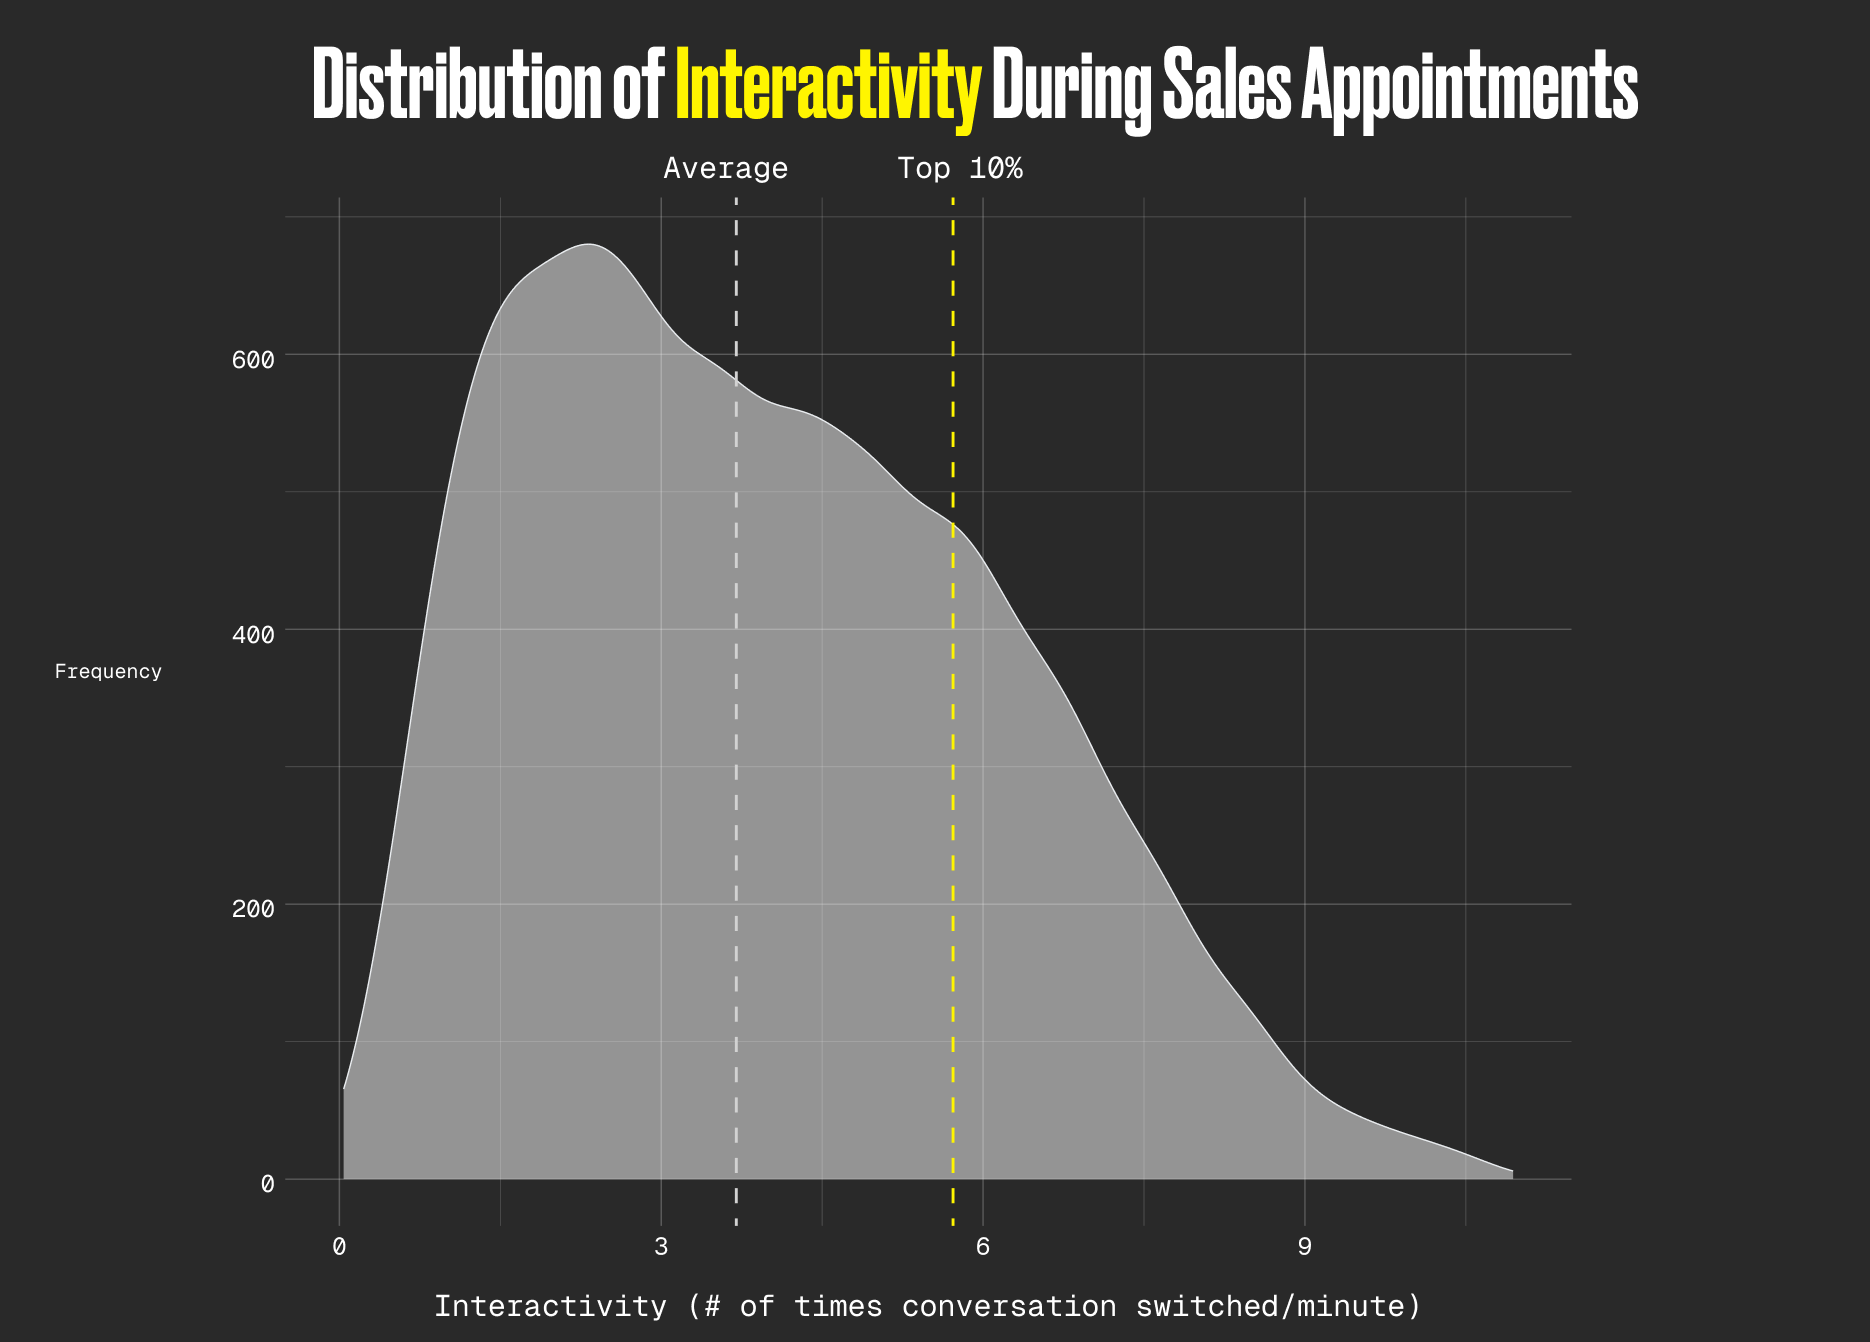
Top-performing reps engage in significantly more back-and-forth with customers, averaging approximately 5.72 conversation switches per minute compared to roughly 3.70 for their peers.
This difference reflects a fundamentally different conversational structure. Rather than delivering long monologues, top reps create collaborative conversations by asking questions, responding to customer input, and keeping customers actively involved throughout the appointment.
Making the Insights Coachable
Taken together, these findings show that the behaviors separating the top 10% of reps are concrete and repeatable.
1. Long appointments create space for better selling.
The roughly 50-minute duration gap between top performers and average reps suggests that patience, deeper discovery, and thorough objection handling—not just closing logistics—drive better outcomes.
2. Script adherence enables consistency.
Top reps follow the script at far higher rates, ensuring key steps in the sales process are not skipped.
3. Interactivity reflects engagement.
Higher interactivity indicates more collaborative conversations and greater customer involvement.
Run This Analysis on Your Own Team
With Rilla Intelligence, sales leaders can analyze their own sales conversations at scale and uncover which behaviors drive success inside their organization.
To replicate this analysis on your own data, ask Rick:
Show me bar charts of how script compliance, patience, and interactivity each affect close rate over the last 90 days. Then, analyze the transcripts of conversations that were successfully closed (“Sold”) and had the best talk metrics to extract actual sales rep behaviors—such as discovery questions, objection handling, or closing language. Provide real customer quotes and sales rep quotes that illustrate what top performers are saying to win deals.
Subscribe to our Newsletter


