Rilla Reports
Want to unlock data specific to your company?
For years, sales leaders made coaching decisions without full visibility into all of their sales appointments. Not because they lacked discipline—but because observing every single conversation at scale wasn’t possible. Ridealongs showed a handful of moments. The rest was more guesswork than science.
With Rilla Intelligence, that constraint is gone. We can now analyze sales behavior across thousands of appointments and answer a long-standing question:
What behaviors consistently separate the top 10% of sales reps from everyone else?
Our Methodology
We analyzed thousands of in-person sales appointments using Rilla Intelligence. For each appointment, we measured a variety of rep and talk metrics—including appointment duration, script compliance, patience, and conversational interactivity—and modeled how each relates to close probability.
We then compared behavior distributions between top-performing reps (top 10% by revenue) and the average rep to identify which behaviors top performers consistently exhibit.
Appointment Duration and Close Probability
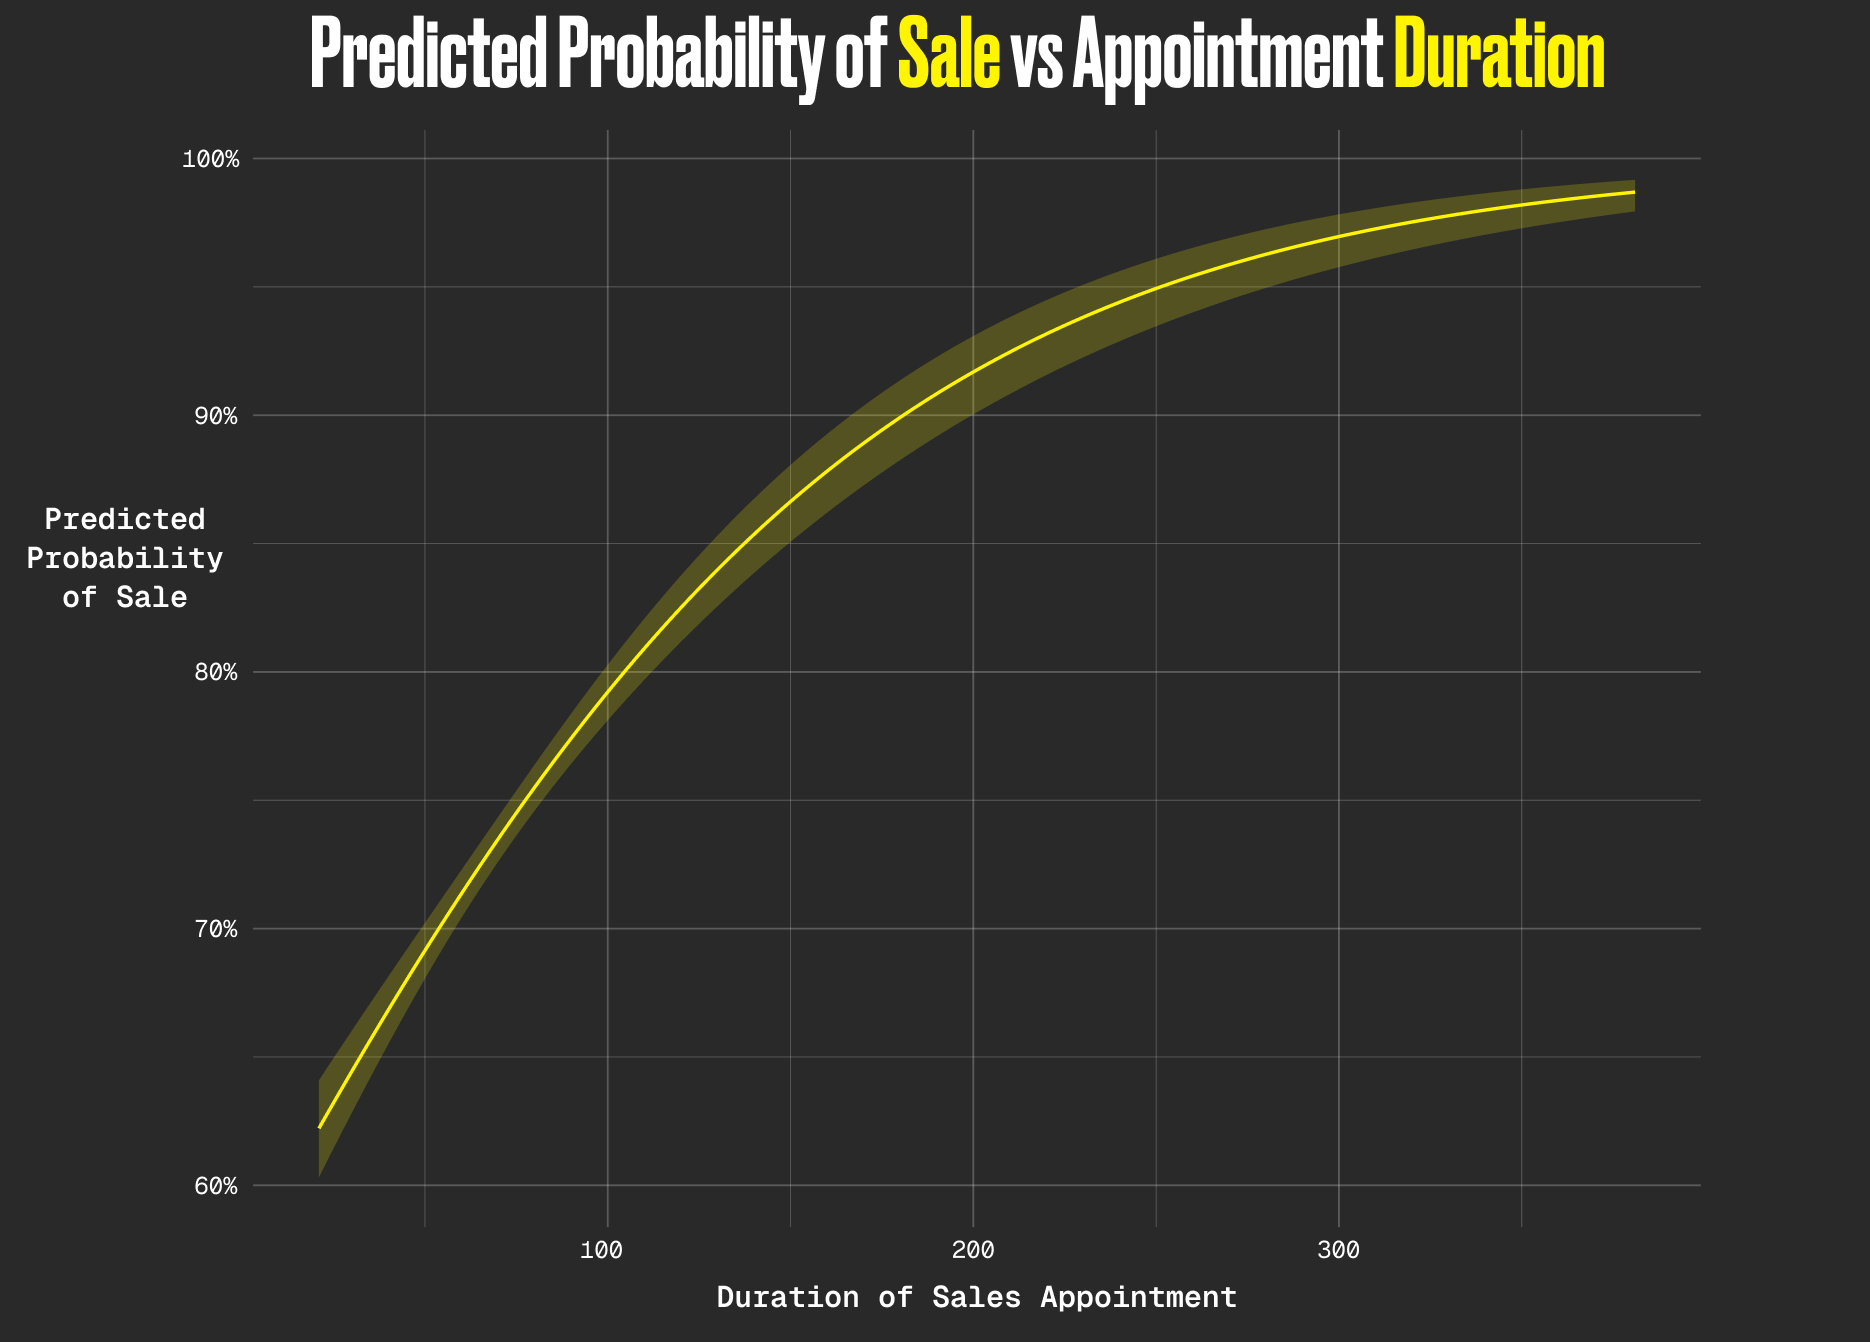
This visualization shows a strong positive relationship between appointment duration and the probability of closing a sale. Predicted close rates increase from approximately 70% for appointments under 60 minutes to over 90% for conversations lasting more than 200 minutes. The shaded bands represent 95% confidence intervals around the model’s predictions.
While successful appointments often run longer due to financing or logistics, the strength of this relationship suggests something more fundamental. Longer appointments allow for deeper discovery, more thorough objection handling, and greater patience throughout the customer’s decision-making process. Top performers are not staying longer because a deal is already won—they are staying longer to create the conditions that make a deal more likely.
Script Compliance and Close Probability
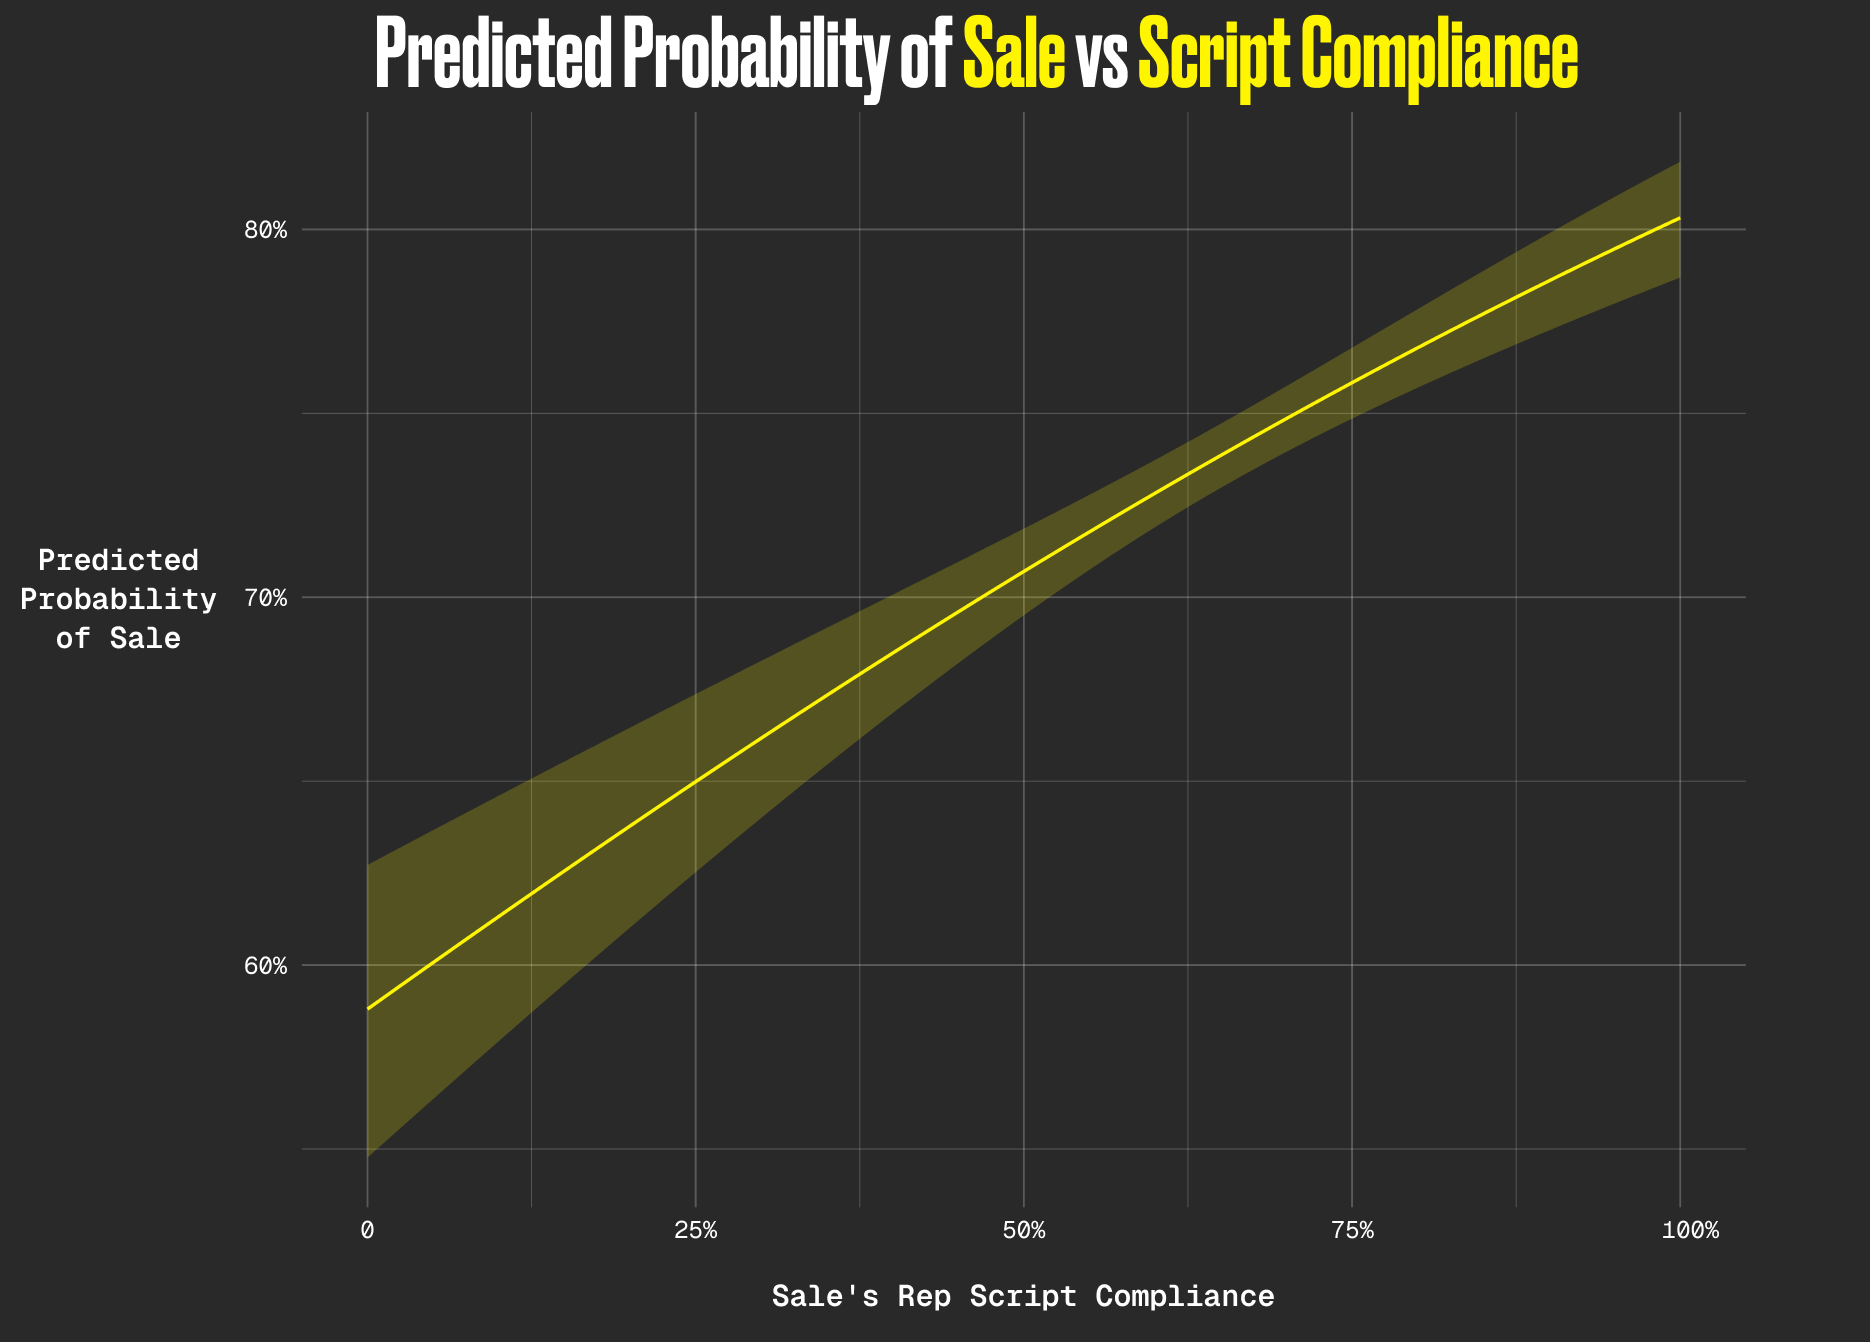
This visualization shows that higher script compliance is associated with meaningfully improved close probability. Reps following the script roughly 75% of the time achieve predicted success rates above 75%, compared to approximately 65% for reps following the script only 25% of the time.
Rather than limiting performance, the script appears to function as a stabilizing framework. Higher compliance ensures critical steps—such as discovery, value framing, and objection handling—are consistently covered, reducing variability in execution.
Script Compliance Among Top Performers
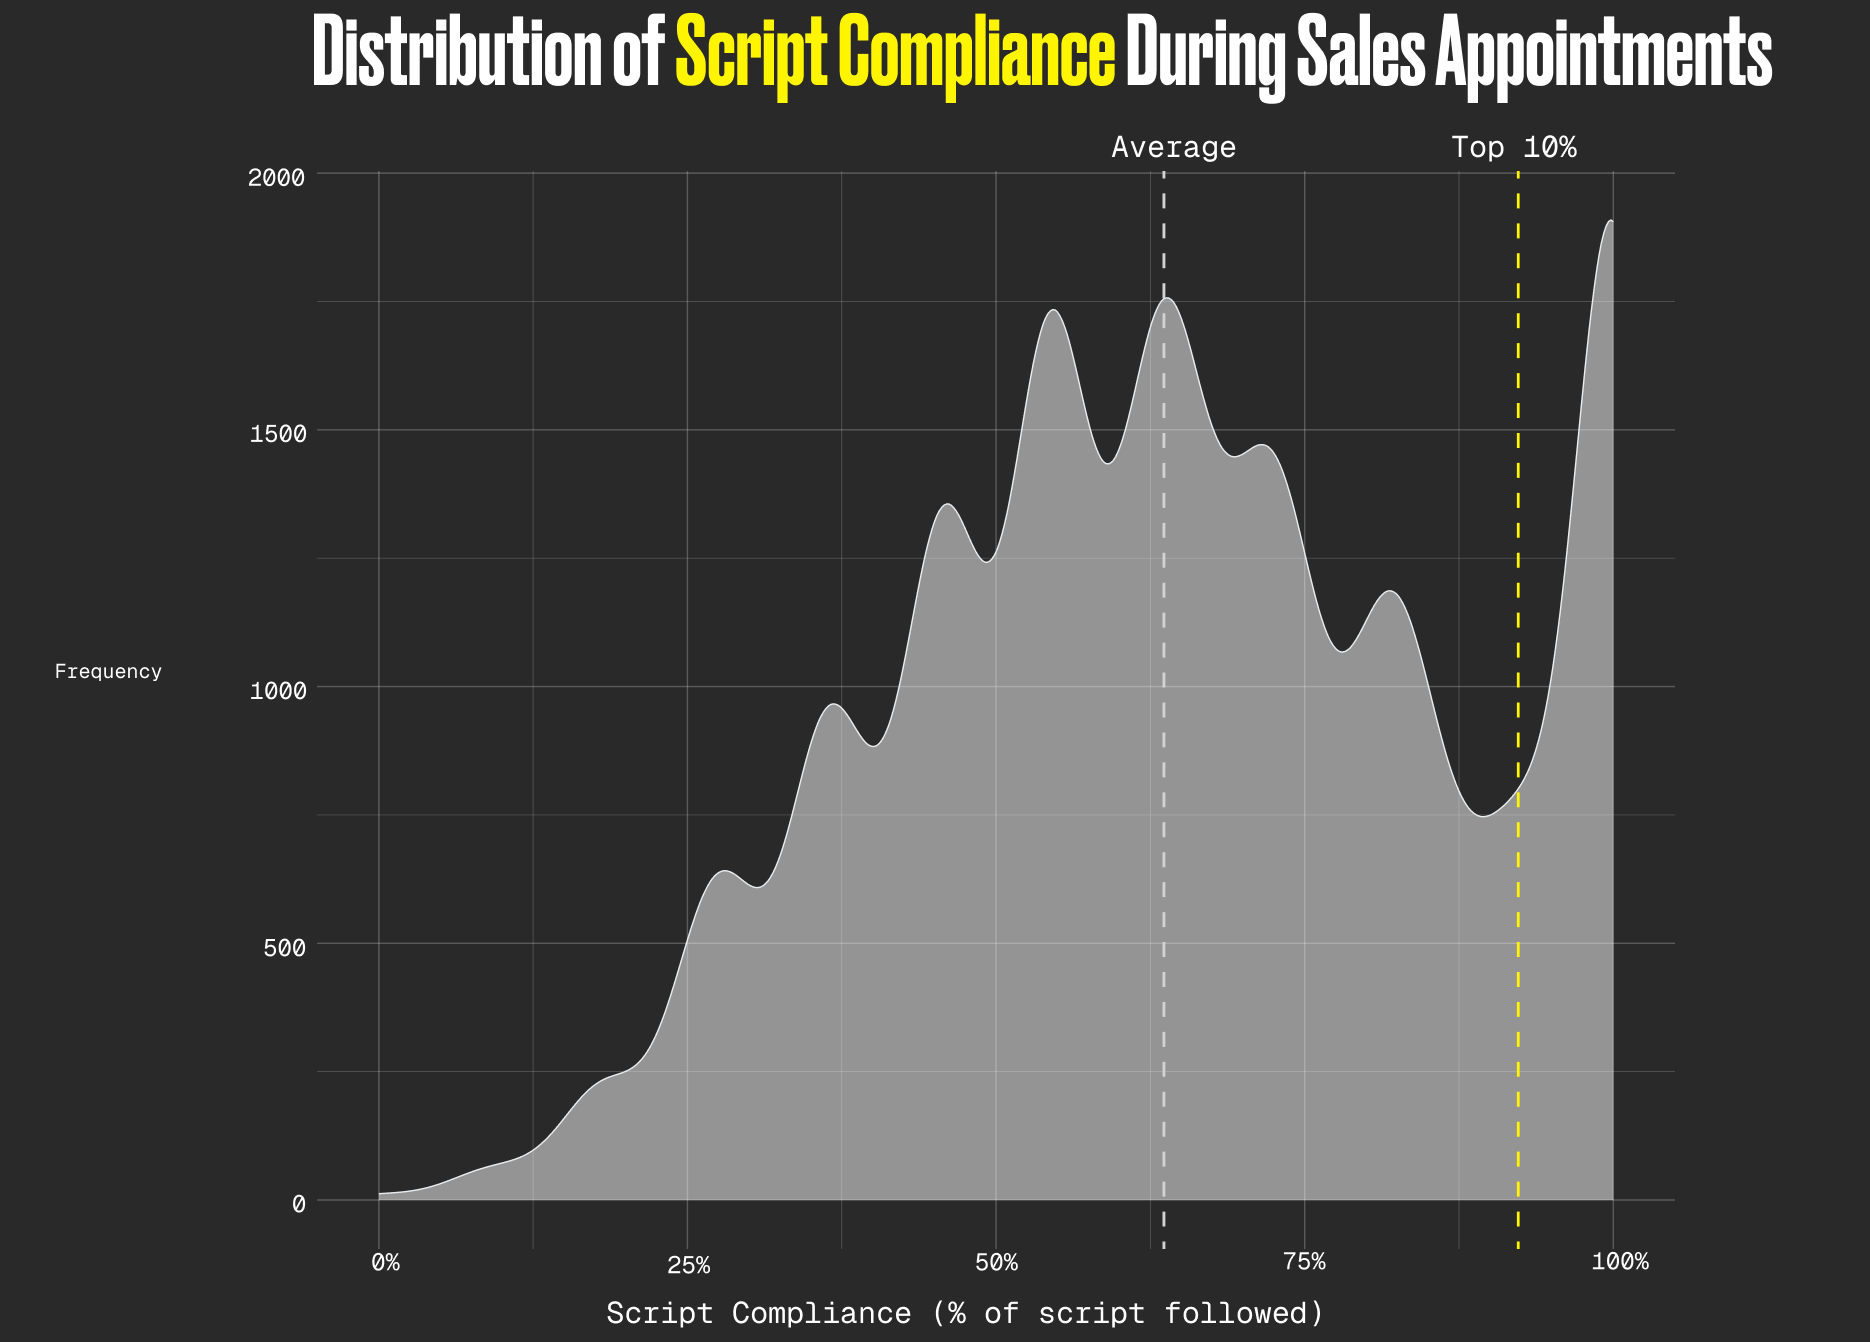
This density plot shows a clear shift in script compliance between the two groups. Top-performing reps demonstrate substantially higher adherence, with a median above 92%, compared to approximately 64% for the average rep.
The shape of the distribution indicates this is not driven by a small group of outliers. High script compliance is a consistent, defining behavior of top performers.
Interactivity Among Top Performers
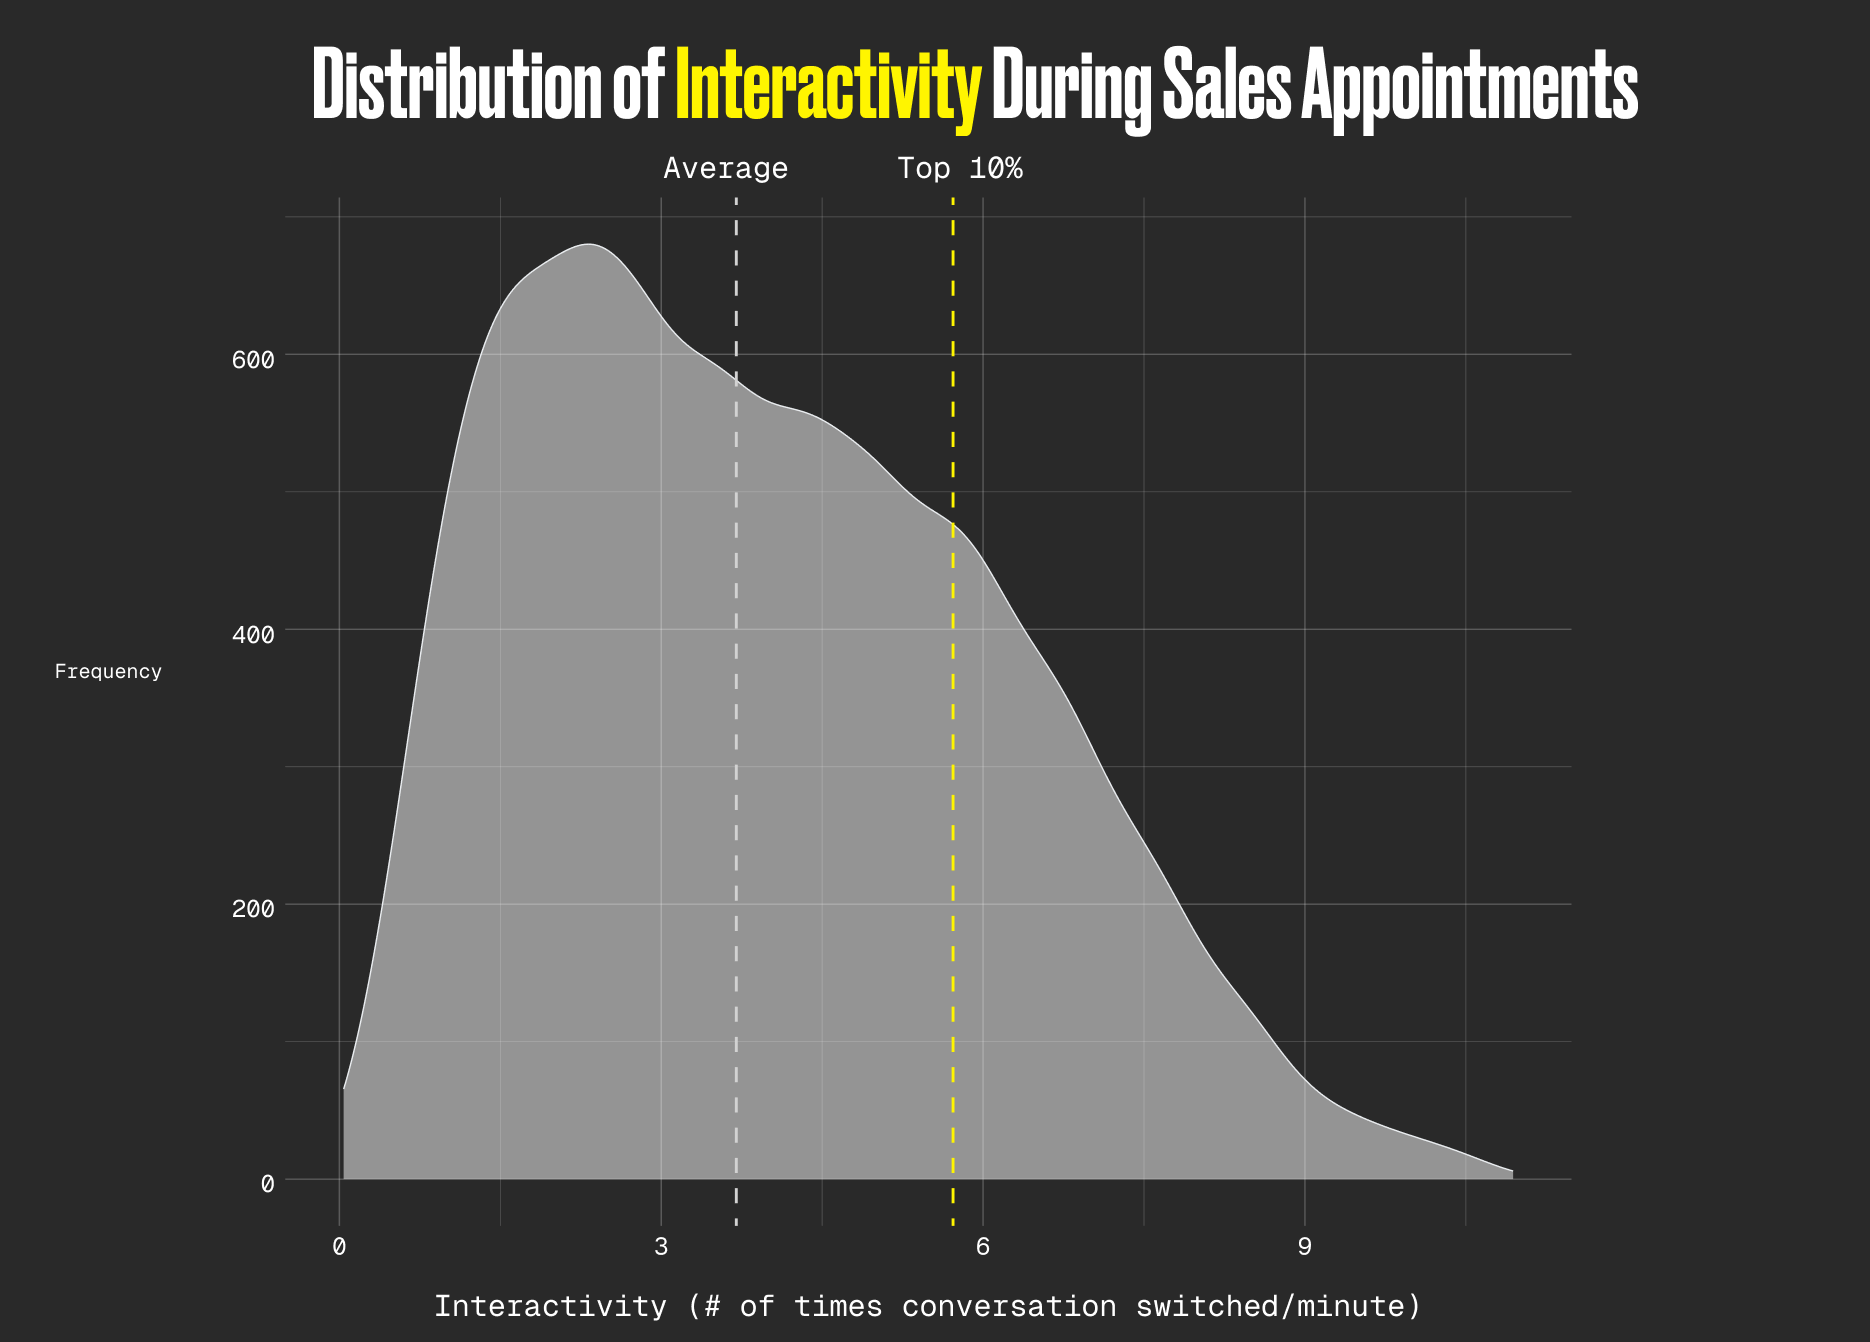
Top-performing reps engage in significantly more back-and-forth with customers, averaging approximately 5.72 conversation switches per minute compared to roughly 3.70 for their peers.
This difference reflects a fundamentally different conversational structure. Rather than delivering long monologues, top reps create collaborative conversations by asking questions, responding to customer input, and keeping customers actively involved throughout the appointment.
Making the Insights Coachable
Taken together, these findings show that the behaviors separating the top 10% of reps are concrete and repeatable.
1. Long appointments create space for better selling.
The roughly 50-minute duration gap between top performers and average reps suggests that patience, deeper discovery, and thorough objection handling—not just closing logistics—drive better outcomes.
2. Script adherence enables consistency.
Top reps follow the script at far higher rates, ensuring key steps in the sales process are not skipped.
3. Interactivity reflects engagement.
Higher interactivity indicates more collaborative conversations and greater customer involvement.
Run This Analysis on Your Own Team
With Rilla Intelligence, sales leaders can analyze their own sales conversations at scale and uncover which behaviors drive success inside their organization.
To replicate this analysis on your own data, ask Rick:
Show me bar charts of how script compliance, patience, and interactivity each affect close rate over the last 90 days. Then, analyze the transcripts of conversations that were successfully closed (“Sold”) and had the best talk metrics to extract actual sales rep behaviors—such as discovery questions, objection handling, or closing language. Provide real customer quotes and sales rep quotes that illustrate what top performers are saying to win deals.
What Actually Separates the Top 10% of Sales Reps?

Most sales training focuses solely on the rep. Coaching them to talk less, talk faster, handle objections, and mirror body language. However, giving sales reps a one-size-fits-all framework for interacting with clients fails to address how the buyer's personality can shape the course of the sales appointment.
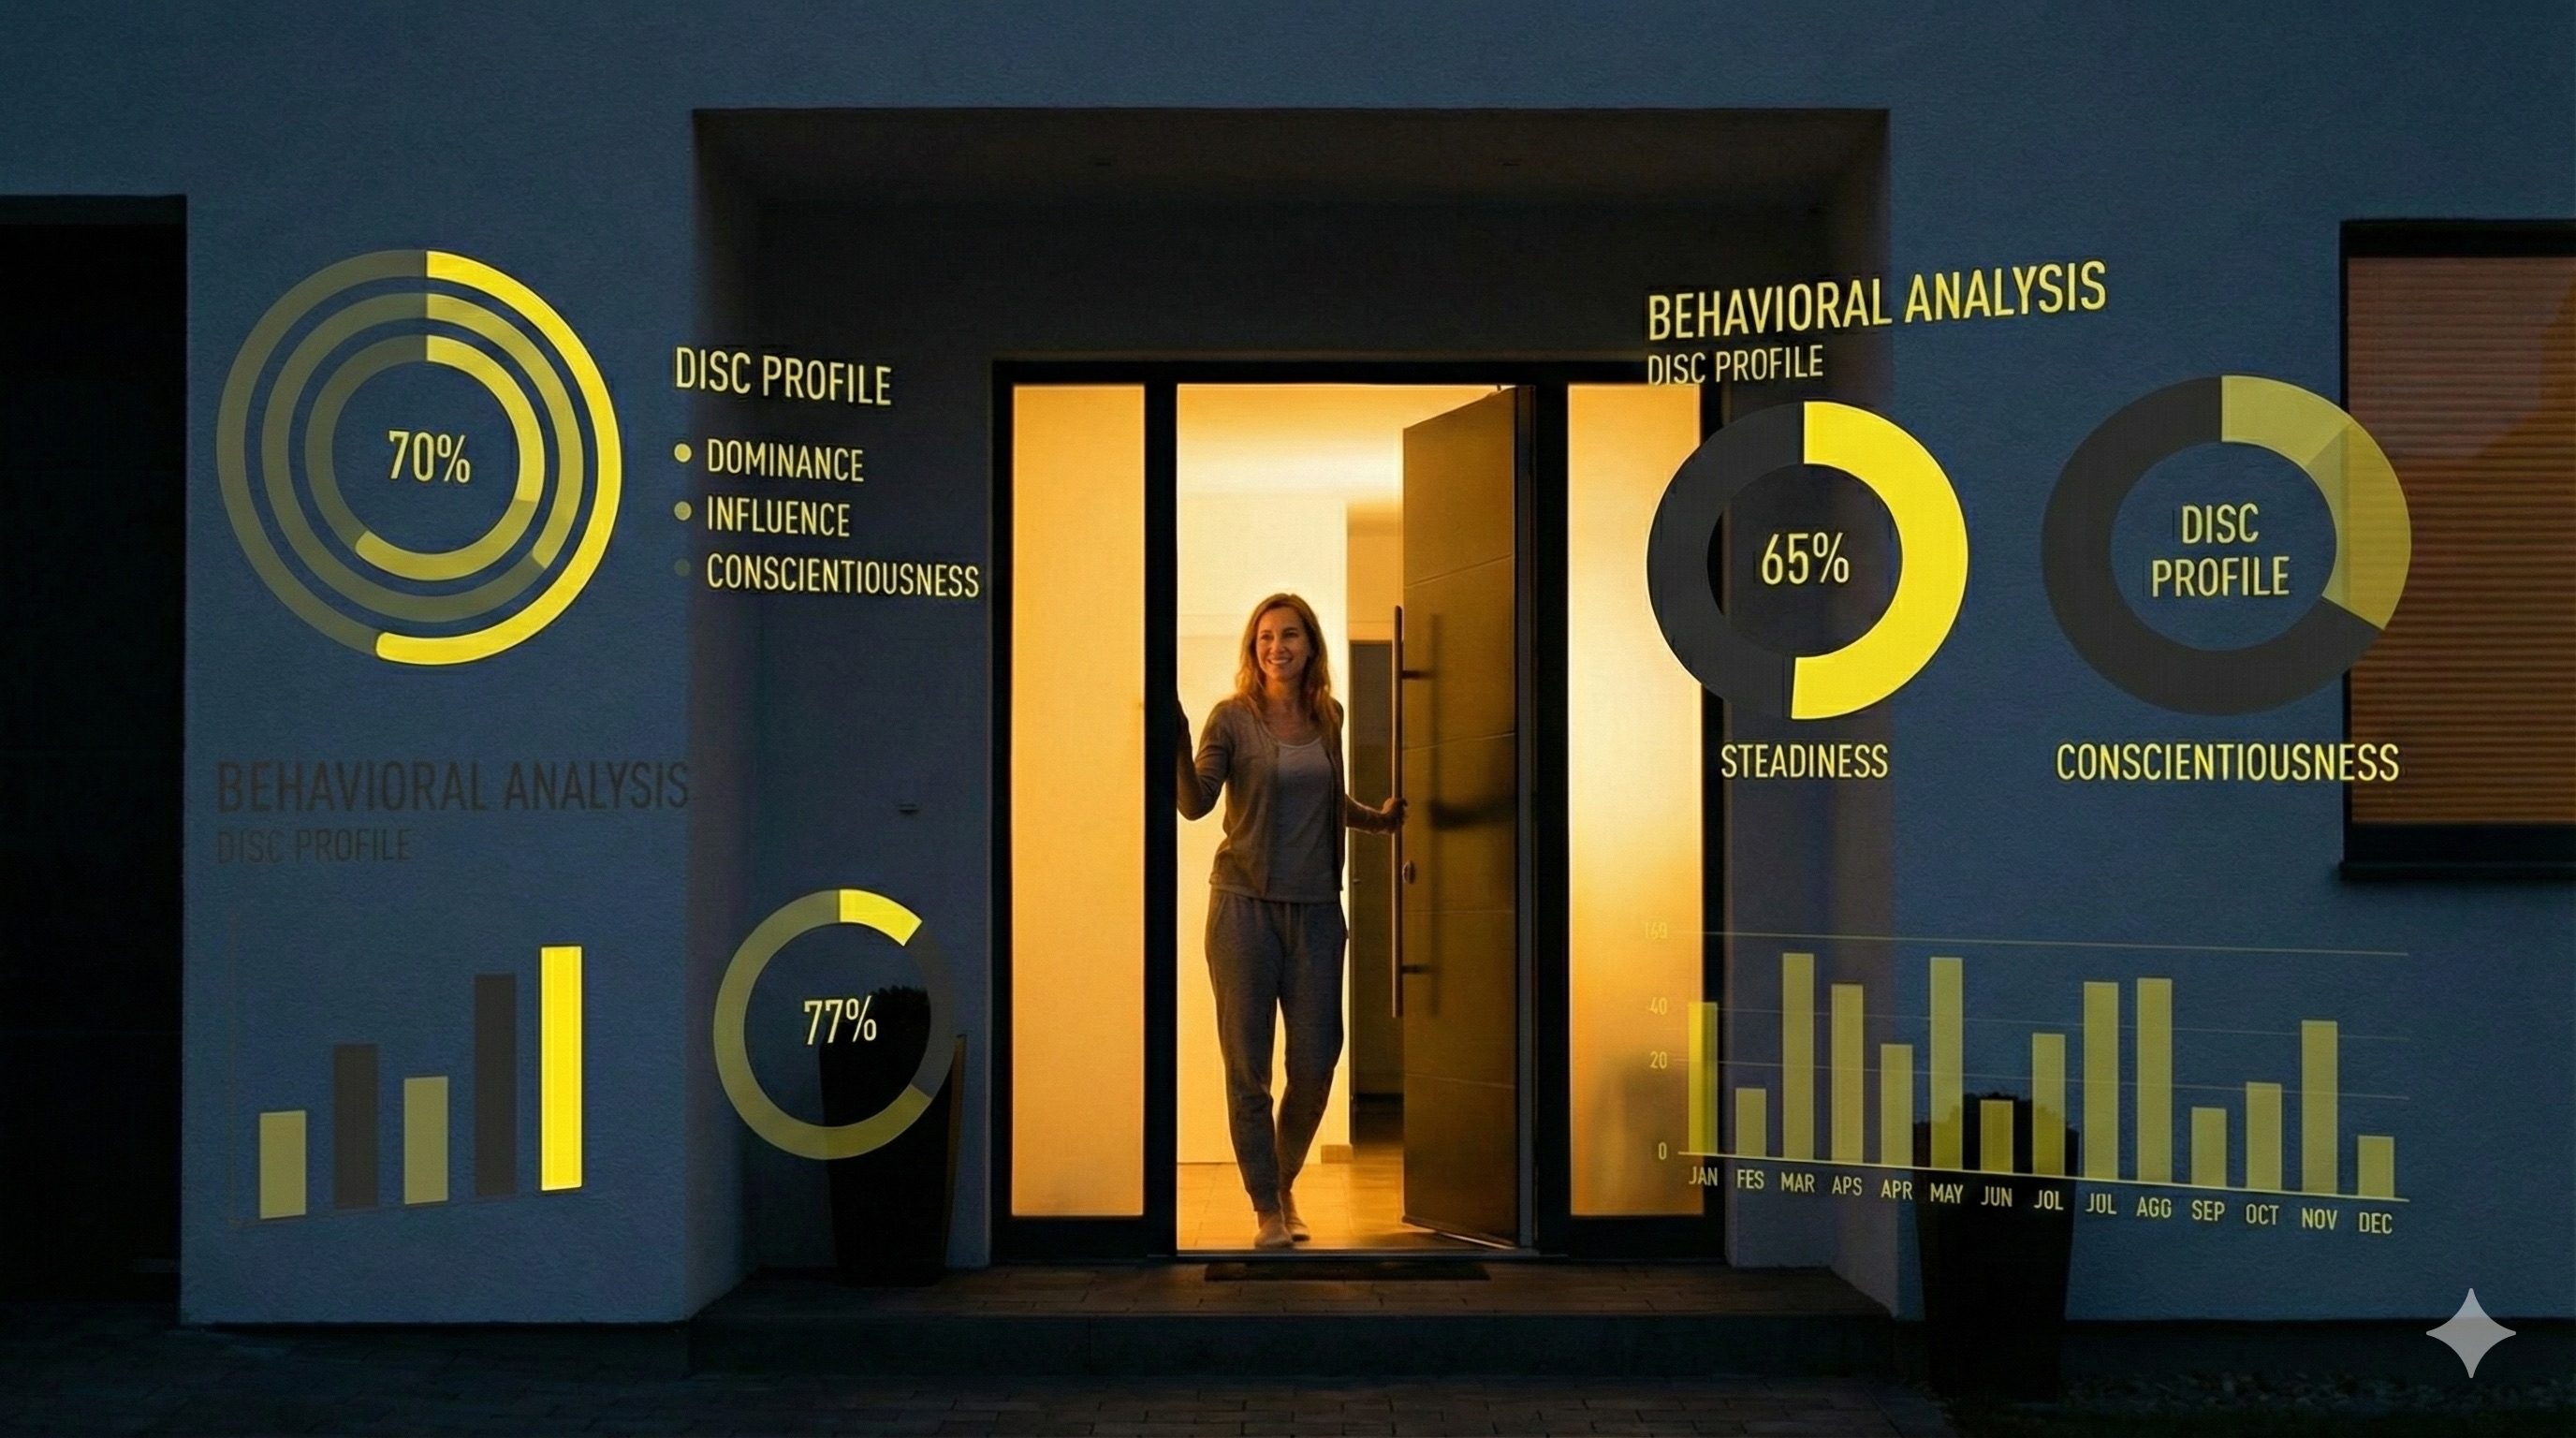
In the past two decades, the four-quadrant DiSC framework, Dominance (D), Influence (I), Steadiness (S), and Conscientiousness (C), has gained traction in the sales world as a way of categorizing how people prefer to act, communicate, and make decisions.
While some sales practitioners widely claim that aligning selling style to buyer personality improves outcomes, there is little evidence that exists on which personality types sales representatives struggle to close or what conversational factors drive success across these types.
We leverage the transcript analyzing capabilities of Rilla Intelligence and a proprietary algorithm for inferring buyer personality type to answer the following key questions: Which DiSC personality types do sales representatives fail to close on most frequently?
And what conversational or behavioral factors are associated with higher closing rates when engaging the most common personality type?
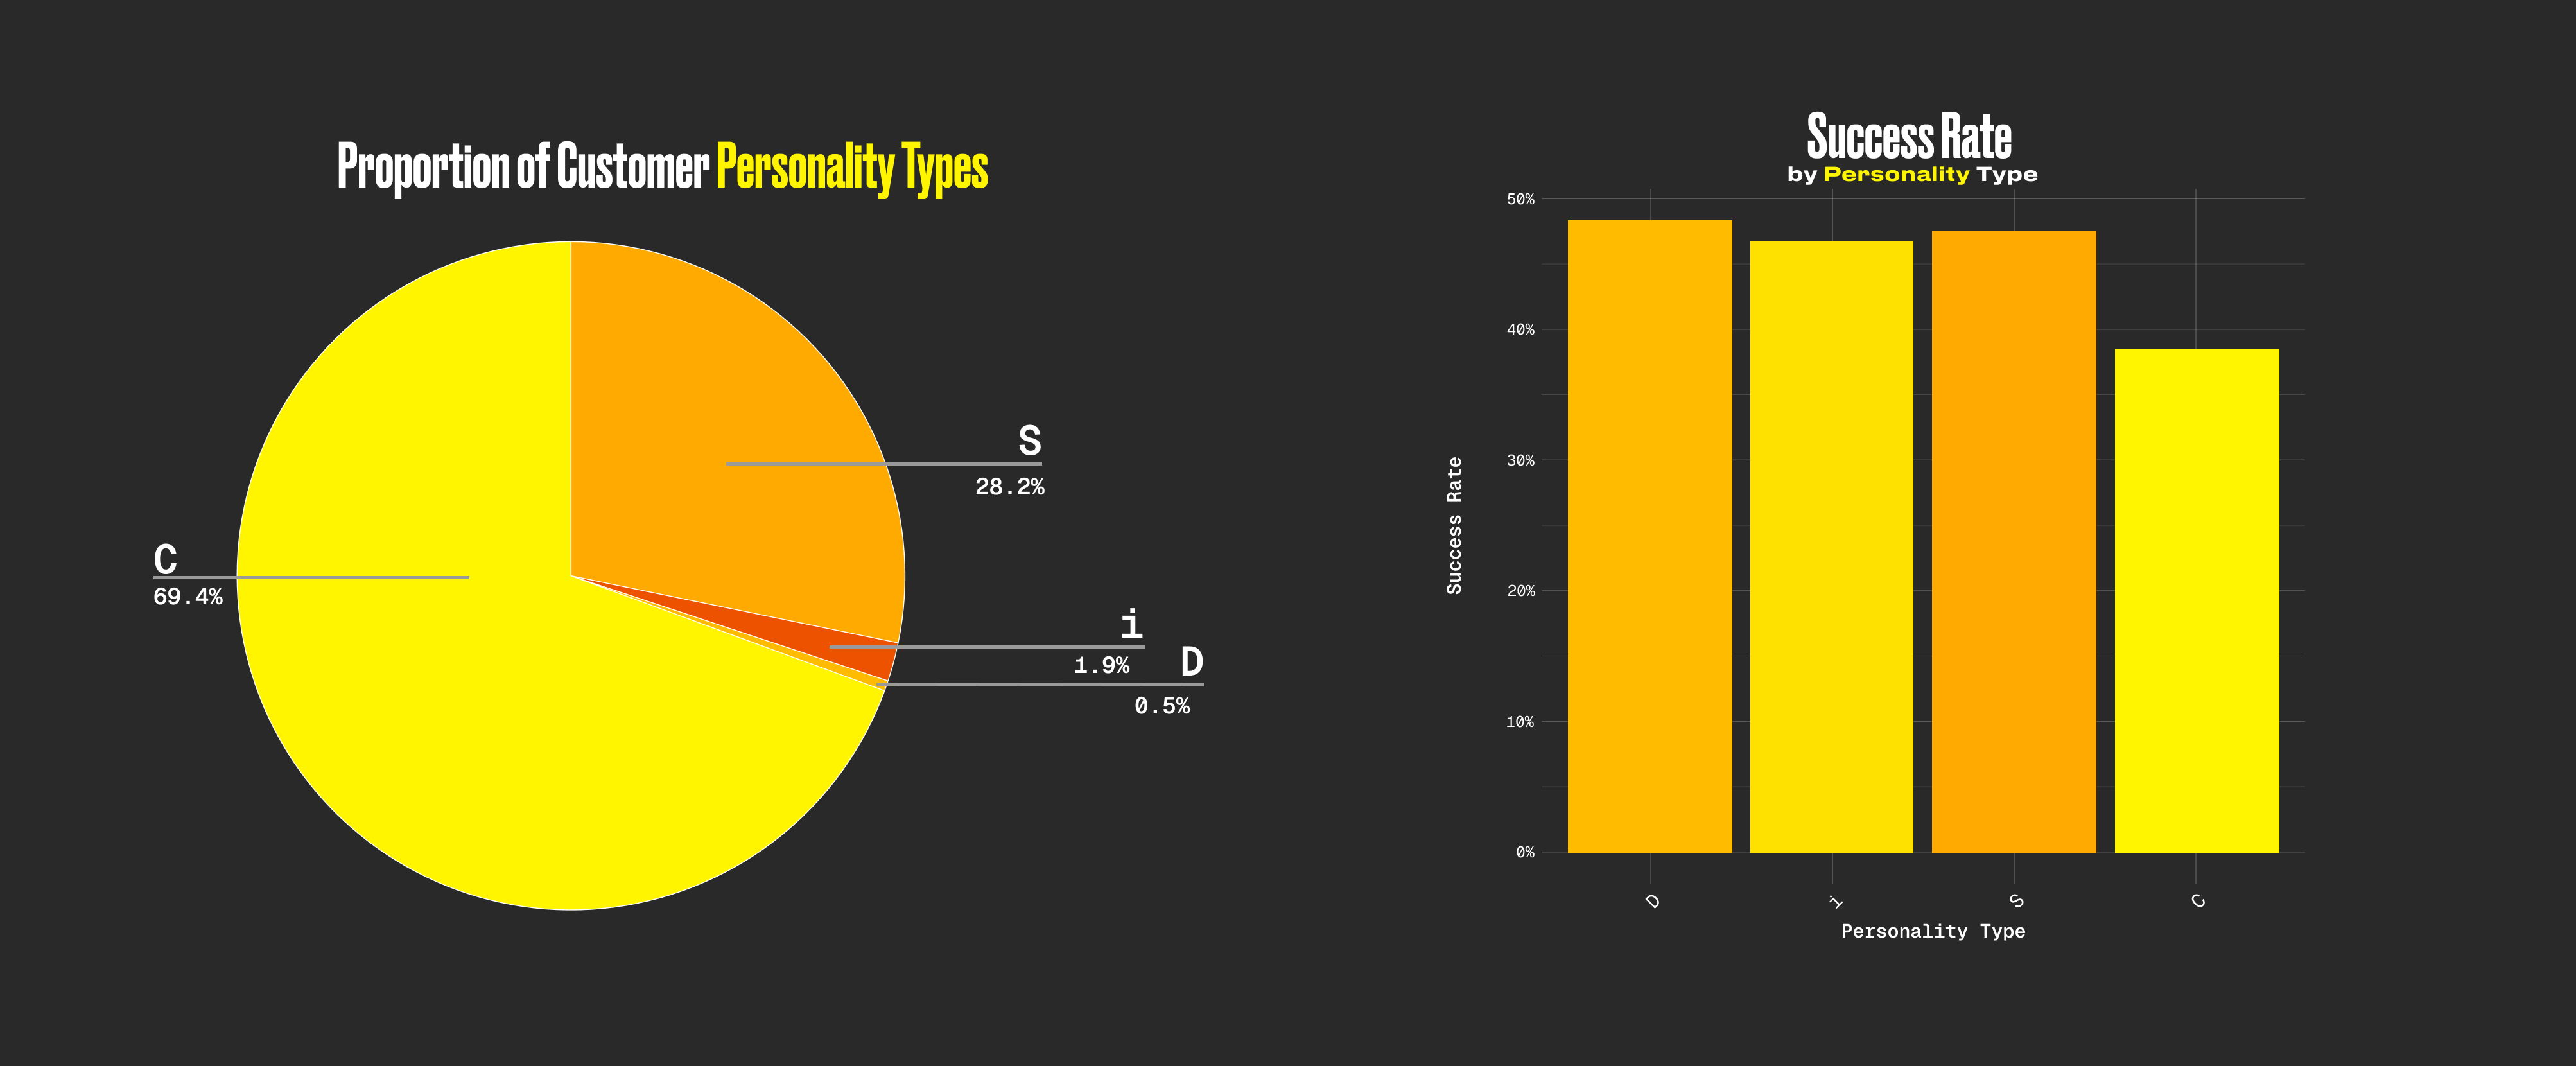
When comparing personality type to close rates, we see that buyer personality may influence sales outcomes. The most prevalent personality type of potential clients is Conscientiousness (C), making up nearly 69.4% of the total conversations analyzed. The second most common type is Steadiness (S), making up about 28.2% of the market, leaving just 1.9% and 0.5% split between Influence (I) and Dominance (D), respectively.
C-style customers make up the majority of the market and sales reps had the most difficulty closing deals with these customers, with only 38% of appointments ending in a sale, whereas appointments with the less common S-type ended in positive outcomes 47% of the time. The next step is to understand how sales representatives can improve sales performance during appointments with C-style customers, as these are the customers sales reps are most likely to interact with.
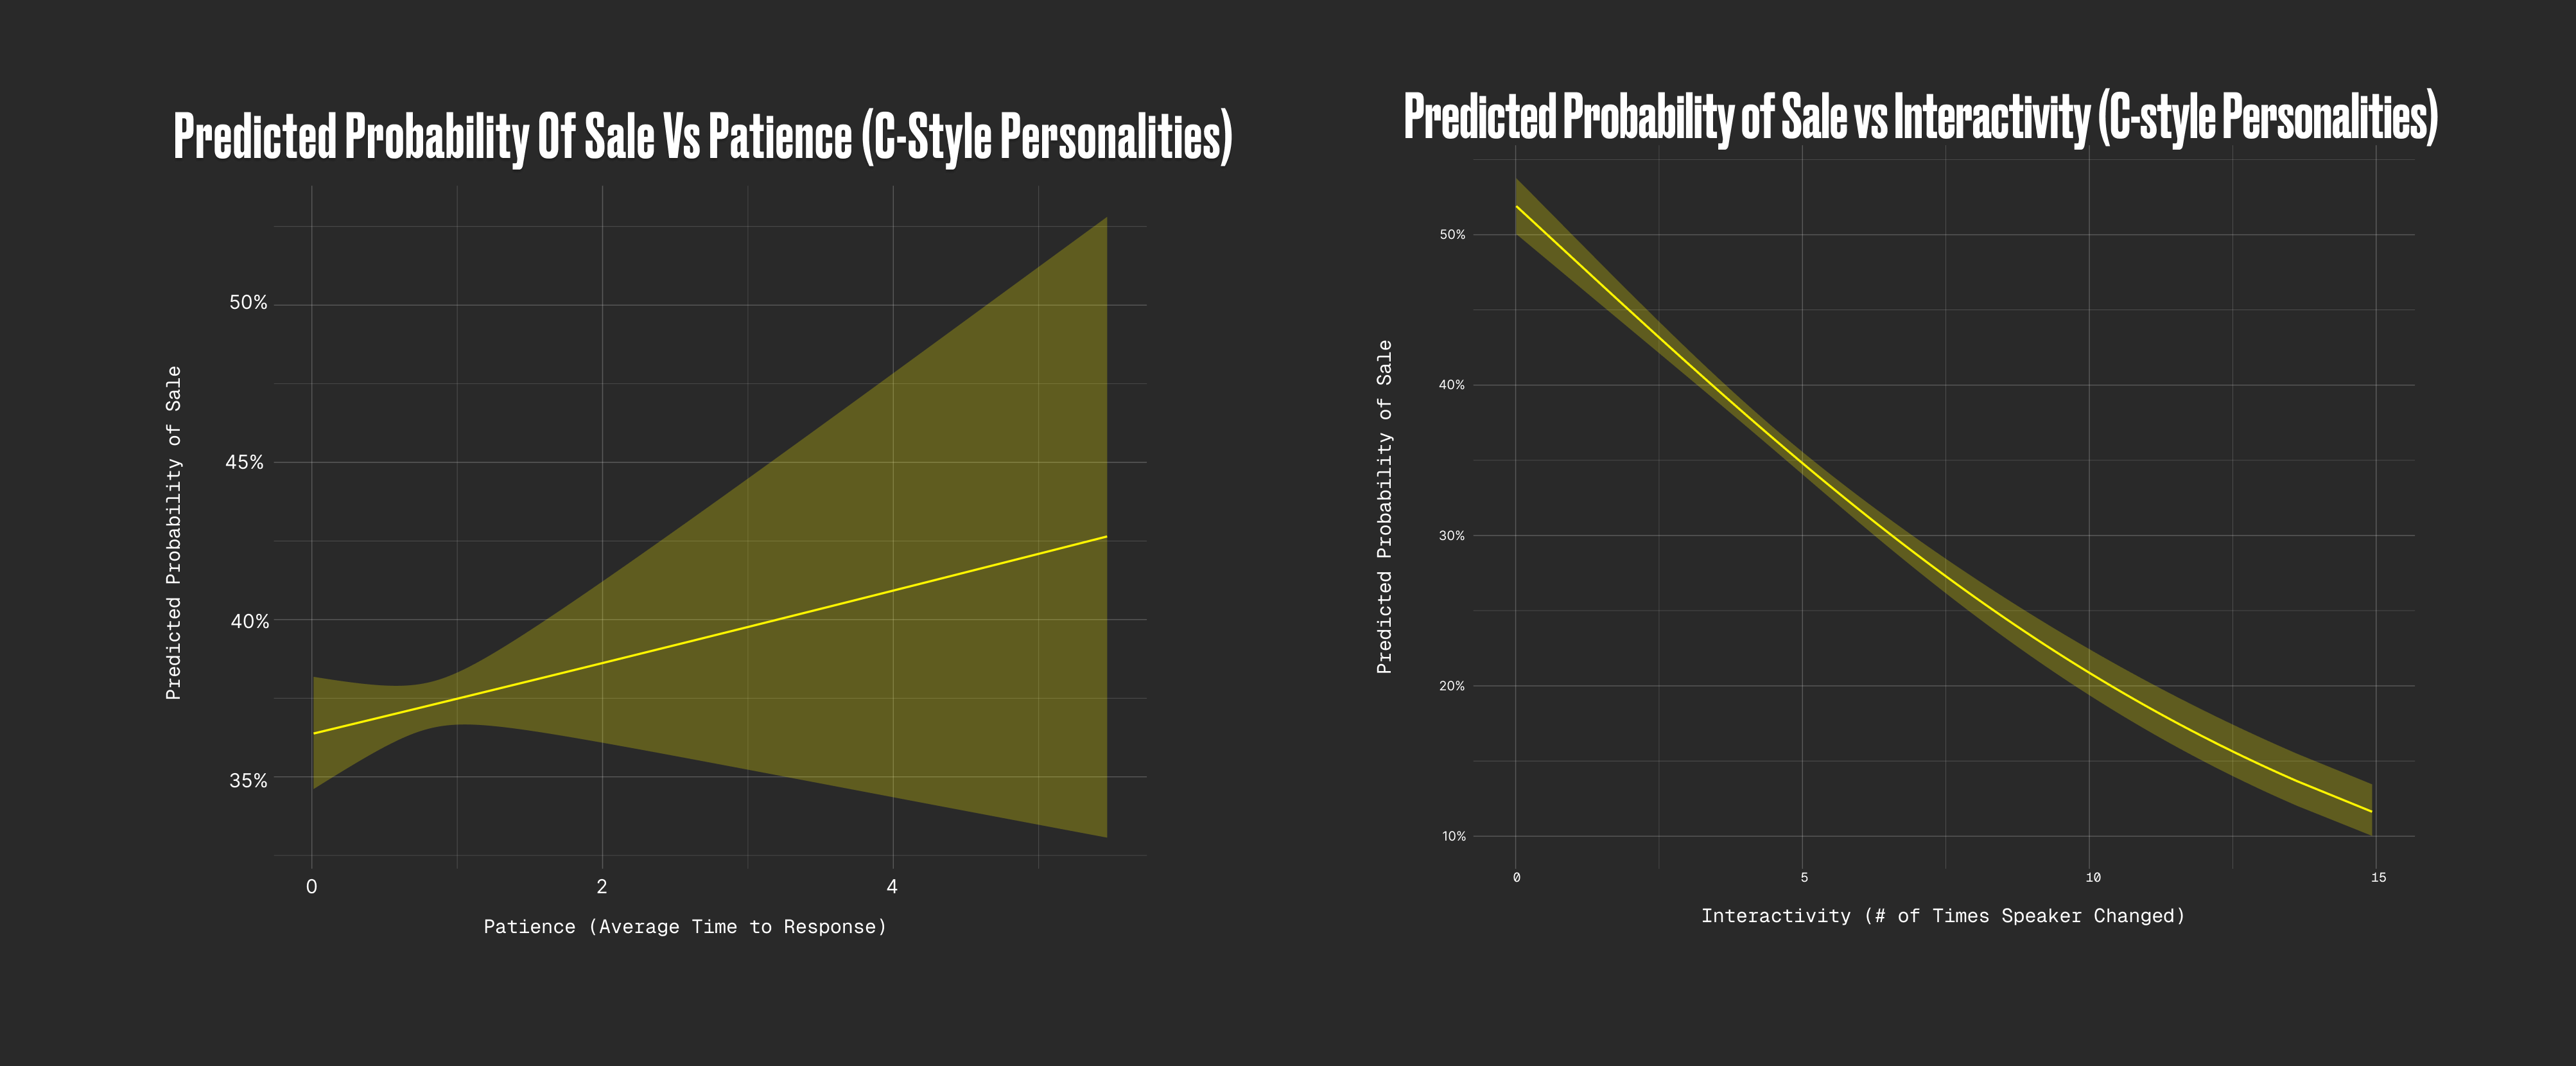
Using a statistical model, we determined that the percentage of the conversation the salesperson spoke (talk ratio), the number of times per minute the conversation switched back and forth (interactivity), how many words per minute the rep spoke (speed), and duration of the sales call (duration), were significantly important in determining the outcome of an appointment. However, the effect each variable has on the result of an appointment varies, with talk ratio and interactivity having the greatest negative impact on the appointment outcome, and patience and duration having the greatest positive impact on the outcome (Figure 2).
Takeaways for Selling to C-Style Personas
Leveraging Rilla Intelligence, we determined that Conscientiousness (C) and Steadiness (S) are the two most prevalent personality types in the market. These findings are consistent with other studies that determined C- and S-style personalities are the most commonly found personalities worldwide. We determined that talk ratio, interactivity, patience, and speed have the strongest influence on the outcome of an appointment. What does this mean for sales managers and salespeople looking to improve their sales performance?
First, sales reps can operate under the assumption that the client they are interacting with is a C-type personality, unless observational or analytical evidence suggests differently. Sales reps should be aware that C-style clients are objective and analytical thinkers, and look for sales reps who demonstrate competency and product fluency (Venkatraman, 2024; Harris-Gray, 2025).
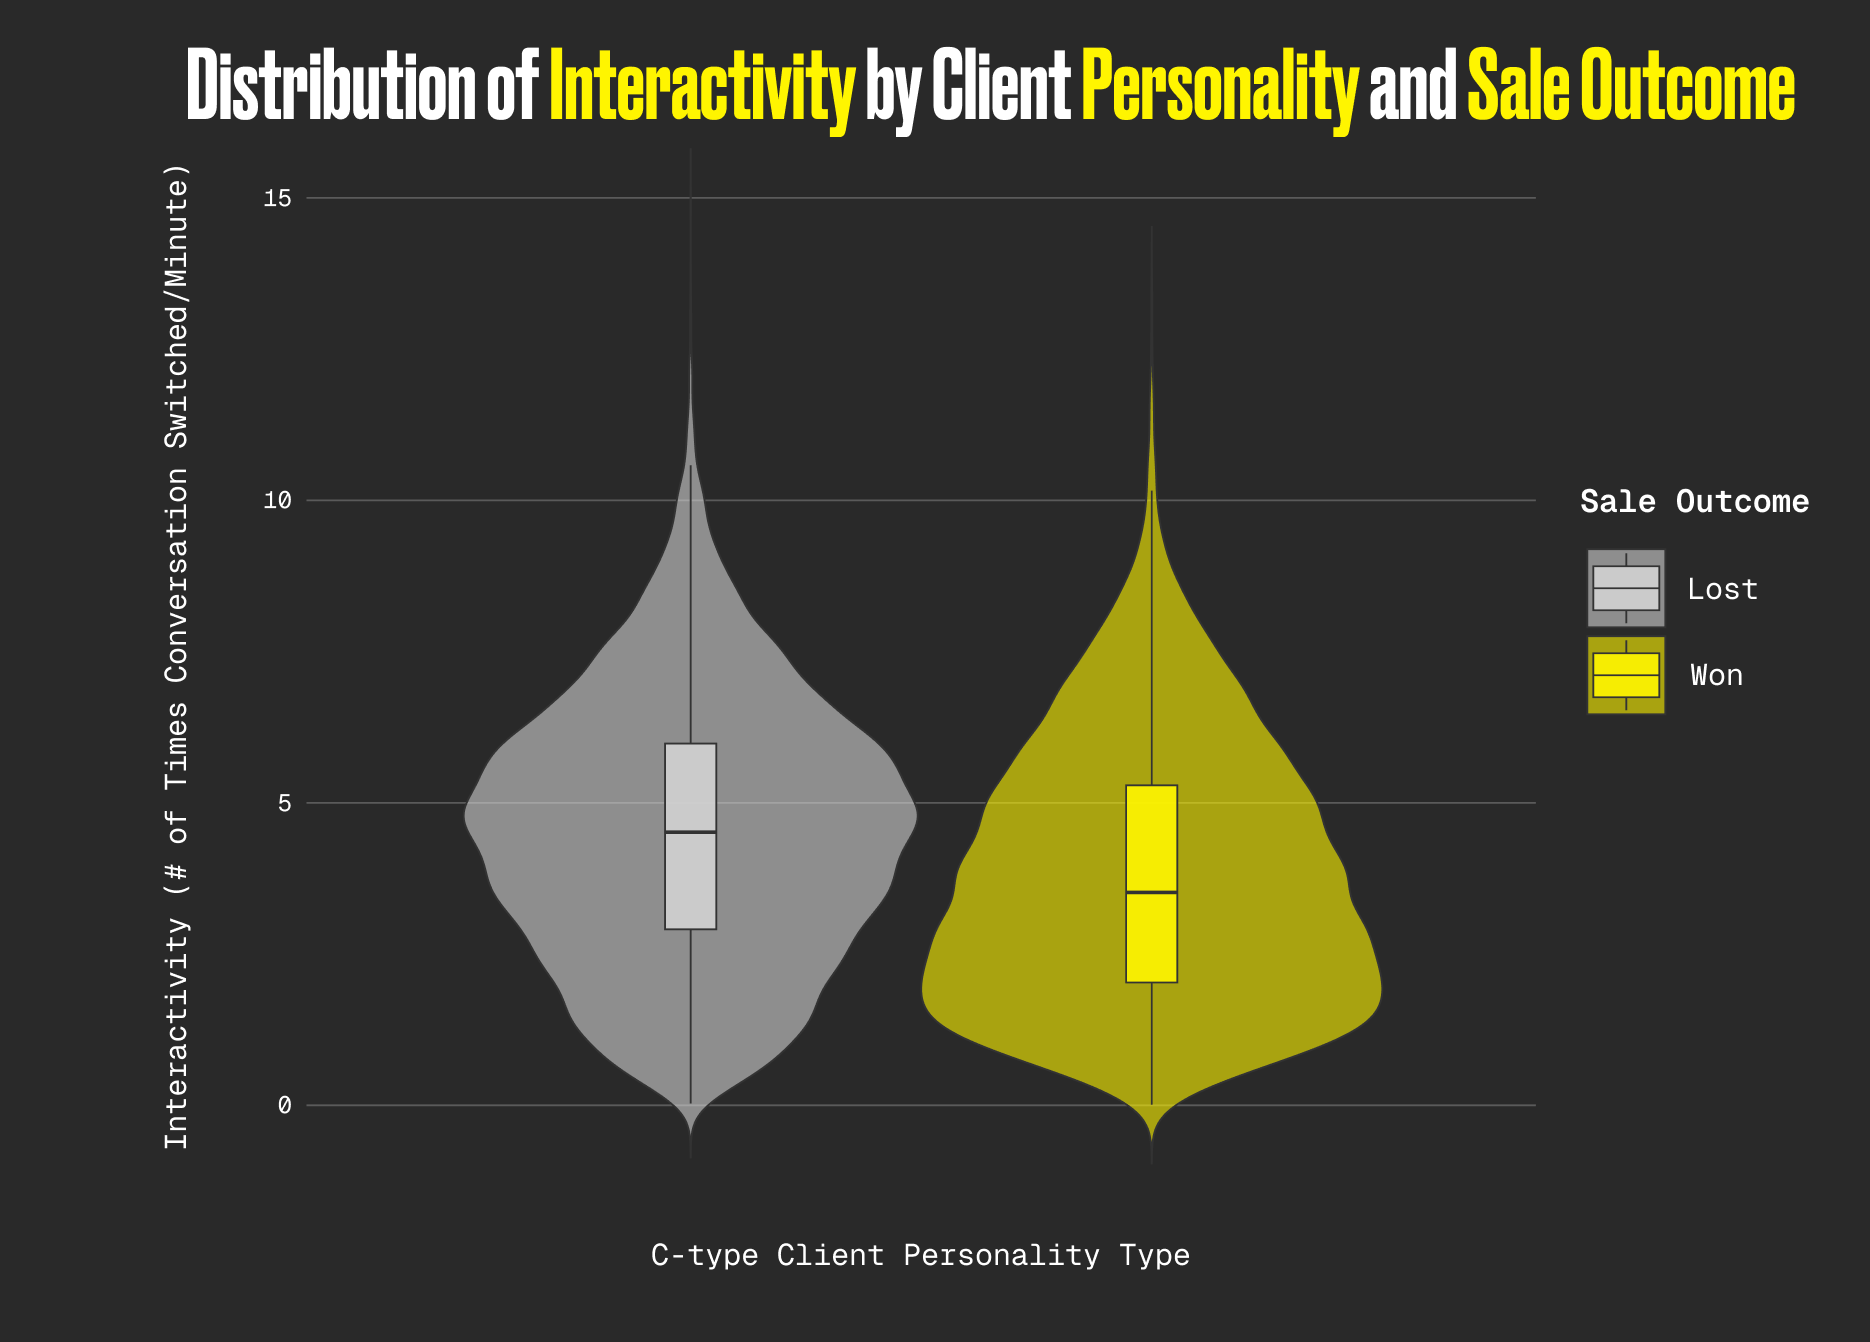
Second, high interactivity between the rep and the client can do more harm than good (Figure 3). Salespeople should limit unnecessary back-and-forth exchanges because too many conversational switches disrupt the buyer’s focus and momentum. Reps who maintain longer, cleaner stretches of explanation create a steadier flow that helps the buyer process information and make decisions more confidently.
Third, conversations should be split 50:50 sales rep to customer. The goal for reps should be to lead the conversation, but allow customers to ask questions. C-style customers want enough information to make a logical decision and will ask insightful questions to gather the information needed.
Finally, patience is key. Salespeople should take their time gathering their thoughts before responding to customer questions. Longer pauses allow reps to think about the customer, their needs, and which information will help the client make the best decision. Also, a longer pause allows salespeople to think of stats and case studies they can provide to this analytical personality type.
This study used client transcript data from across the US; therefore, patterns and trends may not hold for your area or market. We recommend conducting a similar analysis tailored to your client transcript data using Rilla Intelligence.
References
Harris-Gray, A. (2025, January 27). DiSC Customer Styles: Selling to the different personality types. DiSCProfile.com.
Venkatraman, A. (2025). How to Sell to Different Disc Personalities? Happysales.com. Happysales.
Which Personalities Say “No” to the Sale Most Often?
What if the day and time you booked an in-person sales appointment was just as important as your pitch? In the online selling world, this information is readily available. A recent study done by Hubspot highlights that the best day and time to sell over a video call is Tuesday between 10 am and 12 pm.
However, for the 90% of businesses who conduct their sales in person, impactful insights such as this were previously unavailable. The lack of data-driven appointment scheduling can cost sales representatives valuable time and deals that should be won, resulting in revenue slipping through the cracks.
Today, we provide the first ever study to determine which days and times are best to book in-person consultations with clients. These groundbreaking insights can be used by companies to optimize scheduling, maximize sales and boost the effectiveness of a company's sales force.
We leveraged Rilla Intelligence, which has metadata on the outcomes of recorded appointments for over 1,300 companies, to determine which times and days of the work week are the ideal times to schedule in-person sales appointments. For this analysis, we accessed the variables of interest (date, time, and appointment outcomes) from a subset of current Rilla clients from across industries (home remodeling, home building, home services, and auto repair). We drew a random sample of conversations that occurred between January 1st and September 1st of 2025, resulting in a dataset of 16,268 conversations. To measure how successful a day and time was, we created the success rate metric, which takes the difference between the number of calls marked as a win (i.e., “sold”, “invoiced”, “Consultation completed, sale”) and the total number of calls with outcomes that were made during the time period. If time bins had less than 20 total calls, they were excluded from the dataset.


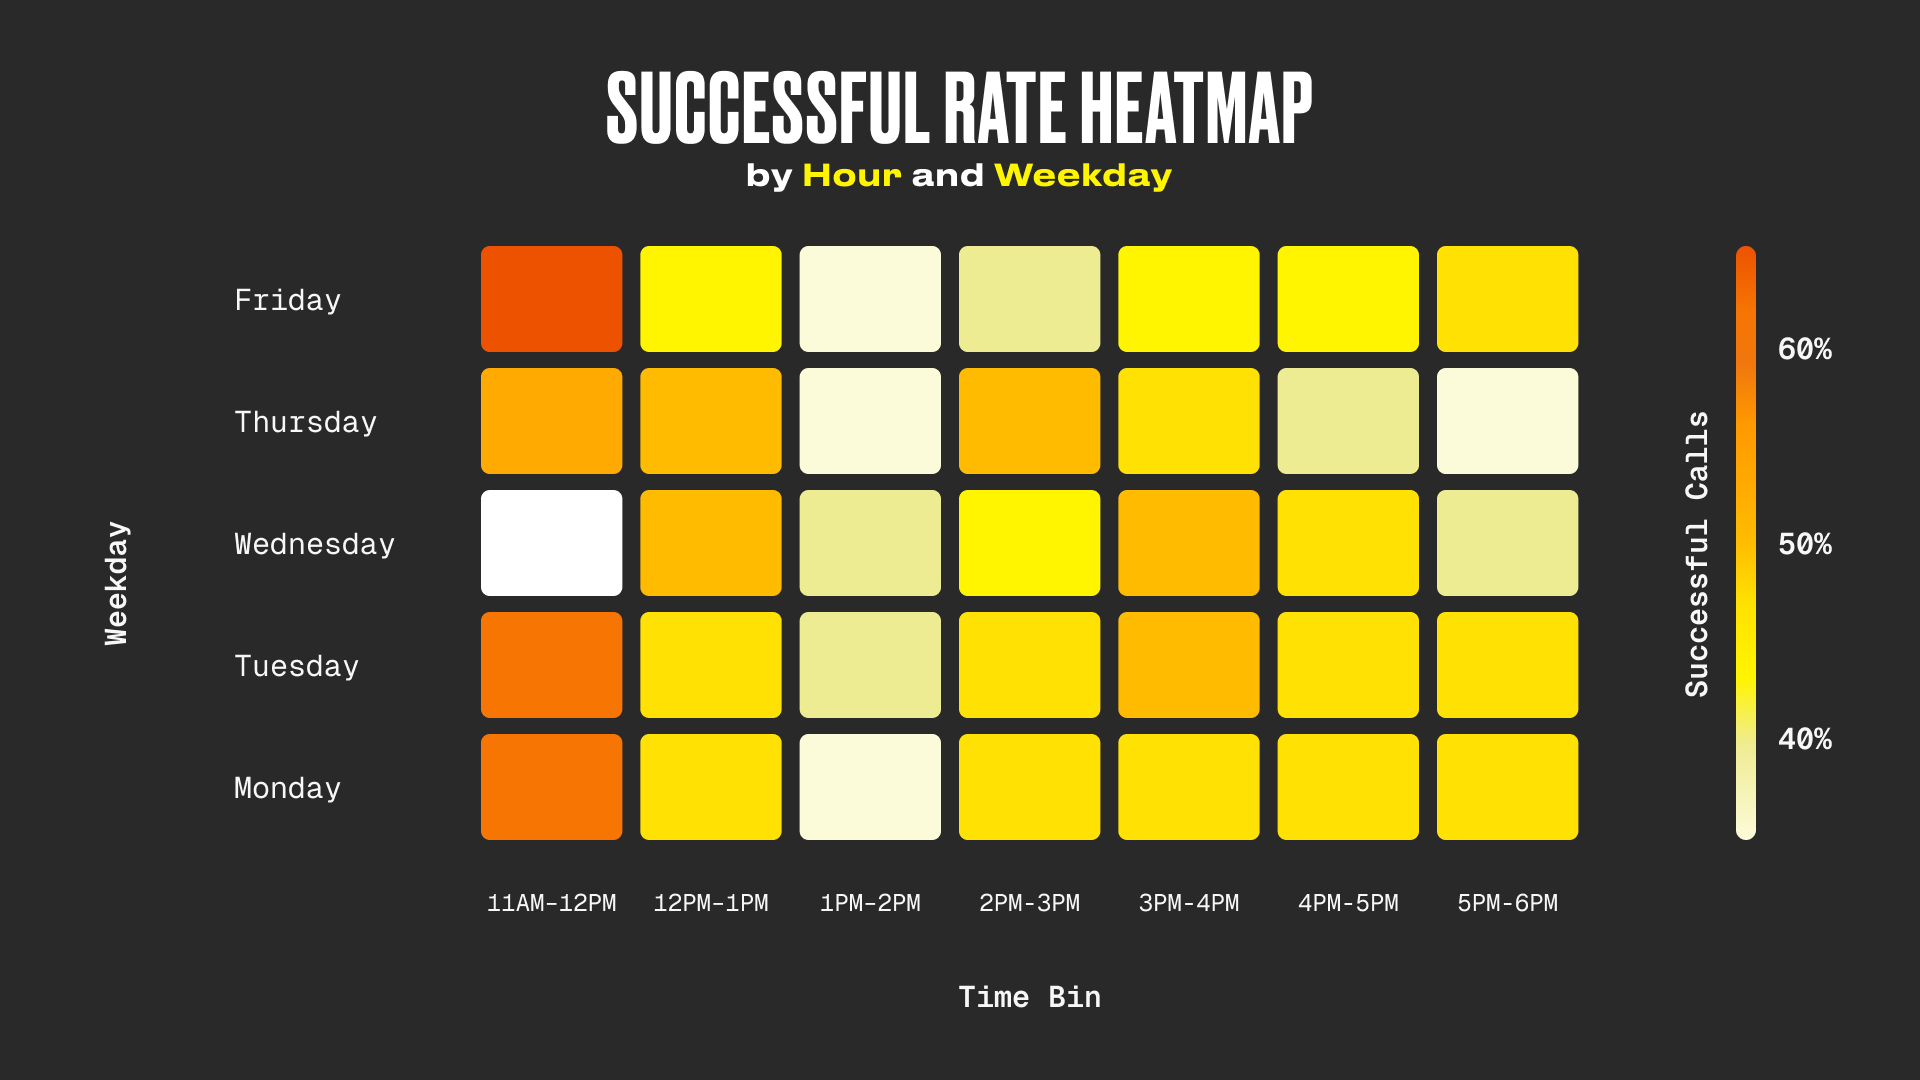
We considered two success metrics: volume, or the number of sales, and effectiveness, the likelihood of a sales call resulting in a sale. From the graphs, we can see that by both volume and effectiveness, Tuesday had the highest number of successful sales and averaged the highest daily success rate, with 3 to 4 pm being the time that averaged the most sales, and 11 am to 12 pm having the highest success rate. However, an appointment on Friday between 11 am and 12 pm is the most effective time bin across the week, as an appointment during this time slot has a 65% probability of being converted into a sale. Catching customers before lunch on Friday has a high probability, but Friday in general has a lower daily average at 43%. Despite the high effectiveness on Friday morning,the worst time to schedule an appointment with clients is just two hours later between 1 and 2 pm, where only 32% of the scheduled appointments end in a sale. Volume wise, Thursday is the worst day for sales appointments, as this is the day we see the lowest number of sales made.
Despite low overall call volume between 11 am and 12 pm on Monday, Tuesday, Thursday, and Friday, this time bin is by far the most effective time to schedule appointments as a consultation has around a 60% chance of being converted to a sale.
Above, we highlight days and times within the work week that have the most sales and where appointments are likely to end in a sale. In order to understand factors influencing unsuccessful sales hours, we used Rilla Intelligence to parse through more than 15,000 conversation transcripts, extracting information on whether the client objects to a sale by mentioning meeting with a competitor at a later date, waiting for a more favorable price, etc. Using the new datadata, we ran a logistic regression model to determine if there is a correlation between objections and dates and times of sales appointments. The model shows a positive correlation between appointments scheduled in the 4 and 5 pm time bin and the probability the client has an objection, meaning that the odds a client objects to a sale significantly increases to nearly 30% between 4 and 5 pm. While not significant, there is a positive correlation between the later part of the week and objections, perhaps suggesting that the territory was covered earlier in the week and the need for services has passed.

Takeaways
Tuesday is the day to staff the most sales representatives and schedule the most appointments as consultations on Tuesday are more likely to end in a sale. On the other hand, Thursday and Friday may be the best day to staff more senior or experienced sales reps in order to overcome the low sales volume and success rate, respectively, associated with those days.
The most valuable insight from the analysis is that customers seem more open and engaged in the pre-lunch window, between 11 am and 12 pm. We suggest shifting more appointments into the late-morning slot. If teams can capture a fraction of that untapped potential, businesses will likely see a noticeable bump in close rates, without adding any more calls to the calendar.
Sales representatives should prepare for more client objections towards the end of the work day with objections peaking around 4 pm. During team huddles on or after Wednesday, sales managers should spend time reinforcing competitor and price objection handling techniques in order to prepare field sales reps for the increased objections.
One thing to consider for your business moving forward is whether to prioritize making the most successful calls possible or prioritize the effectiveness of calls made as the optimum times and days for each vary. Note that this analysis used data from companies across the United States in various different industries. To determine which course of action would best suit your business, we recommend leveraging Rilla Intelligence on your market’s conversation data to determine the sales trends for your market and area.
References
Shahid, Kiran. “The Best Time to Make a Sales Call.” HubSpot Blog, 29 Sept. 2025, blog.hubspot.com/sales/best-time-to-make-a-sales-call.
What Days and Times are the Best for Closing Deals?